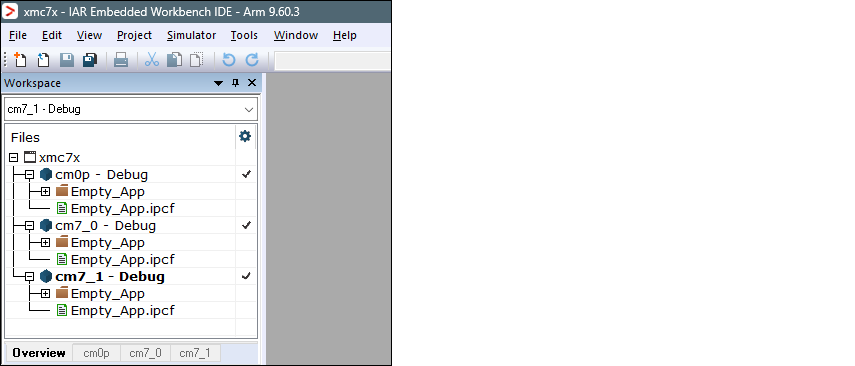
Then, use the instructions in this section to configure, build, program, and debug a multi-core application for PSOC™ 6 and XMC7000 multi-core applications in IAR Embedded Workbench.
Before you can launch a multi-core debug session, all projects within the workspace must be properly configured. In IAR there is a concept of 'master' and 'slave' projects. Configure the CM0+ core project as the master project, and configure the other cores (CM4 for PSOC™ 6 and CM7 for XMC7000) as slave projects.
Configure CM4/CM7 (slave) core(s)
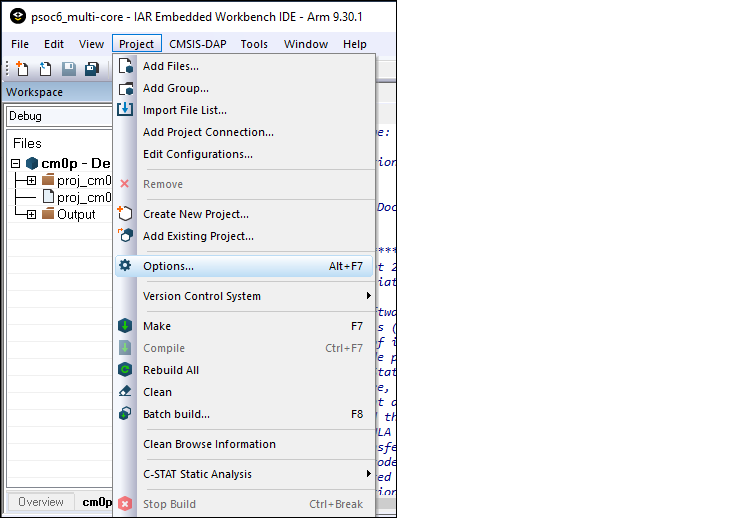
- Select the CM4/CM7 core project and go to Project > Options:
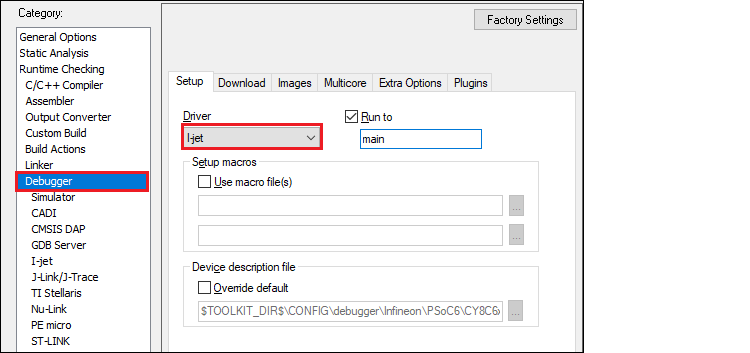
- On the dialog, select the Debugger
category in the Setup tab, and then select the
appropriate Driver (I-jet, CMSIS-DAP, J-Link):
- Enable hex file generation.
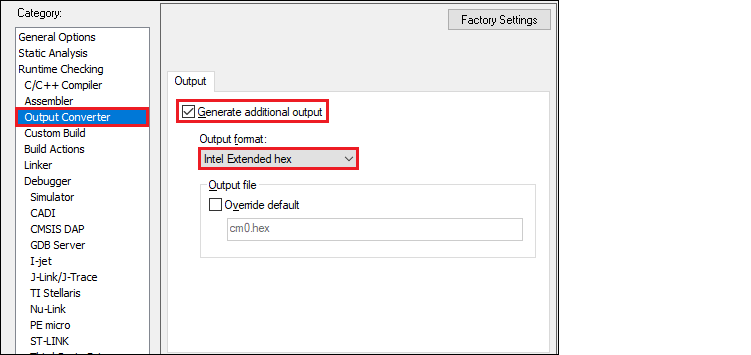
- In the Runtime Checking > Output Converter category, select the Generate additional output check box.
- Ensure Output format is set to Intel Extended hex.
- Click OK.
- Repeat these steps for all CM4/CM7 projects.
XMC7000/TRAVEO™ II specific steps
Some XMC7000 MCUs are triple-core devices. If you are going to use a second CM7 core in your IAR workspace, you need to implicitly set the target core in project settings so that IAR understands this project is targeting a second CM7 core. By default, IAR connects to the first CM7 core, so specifying the target core for it can be skipped.
- Select the project for the second CM7 core and go to Project > Options.
- Select the probe in the Debugger
category, and switch to the Interface tab.
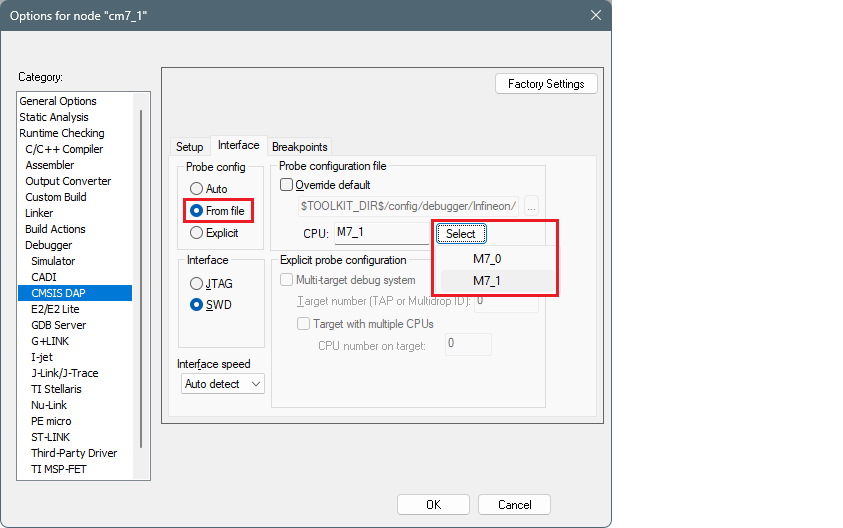
- Select the From file radio
button, click Select next to the CPU label, and choose M7_1:
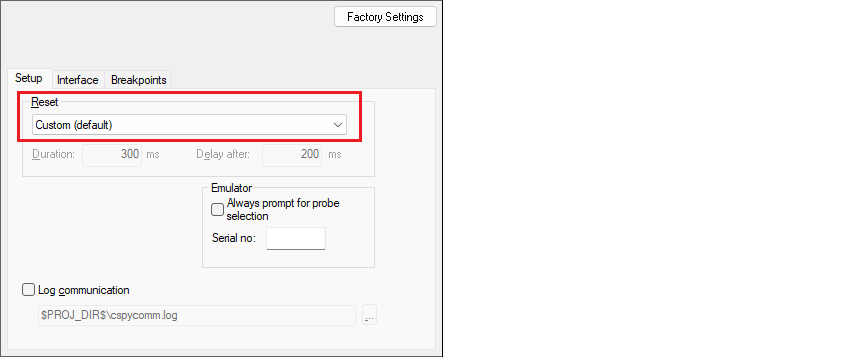
- Switch to the Setup tab, and
select "Custom" from the Reset pull-down
menu.
- In addition, specify a special linker script symbol in the project
settings to distinguish CM7_0 from CM7_1, since there is a single linker script for the
two CM7 cores:
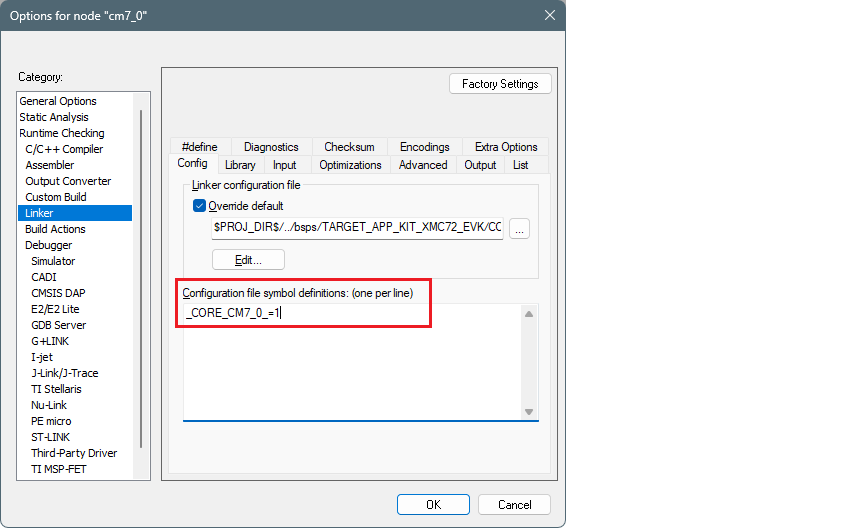
- Select the project for the first CM7 core and go to Project > Options > Linker.
- Add
_CORE_CM7_0_=1in the Configuration file symbol definitions field, and click OK.
- Do the same for the second CM7 core:
- Select the project for the second CM7 core and go to Project > Options > Linker.
- Add
_CORE_CM7_1_=1in the Configuration file symbol definitions field, and click OK.
Note:When debugging CM4/CM7 core stand-alone, make sure to rebuild the CM0+ project in case any changes were made, since launching a debug session only loads the CM0+ image, but does not build that CM0+ project. - Build your CM7 project(s) before moving forward.
Configure and build CM0+ (master) core
- Select the CM0+ project and open the Options dialog.
- On the dialog, select the Debugger category in the Setup
tab, and then select the applicable Driver
(I-jet, CMSIS-DAP, J-Link):
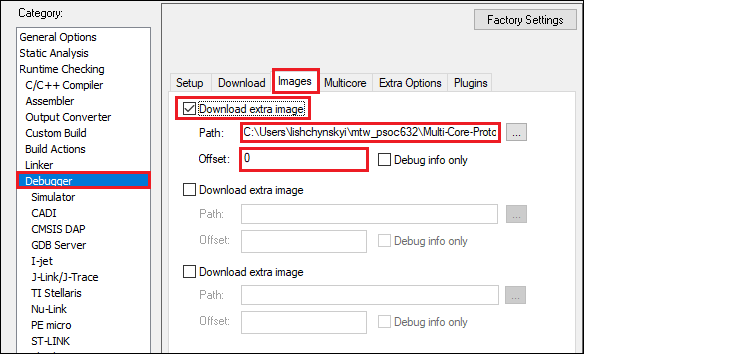
- Switch to the Images tab to specify the extra image to be
downloaded prior to debugging in order to download images of all projects in one
process.
- Select the Download extra image check box.
- Provide a Path to the CM4/CM7's HEX image.
- Enter 0 for Offset.
If you provide an OUT file instead of a HEX file, the IAR IDE will fail to halt at the beginning of
main()due to the main function present in both the CM0+ and CM4/CM7 OUT files.Note:For triple-core MCUs you should download two extra images. - Switch to the Build Actions
category.
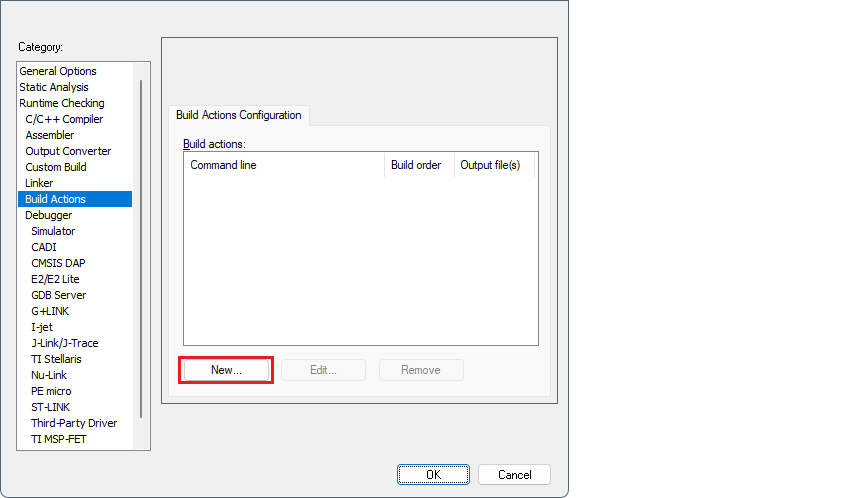
- Click the New button to open the Build Action dialog.
- Paste the following command to build the CM7_0 (or CM4) project
in the Command line field as single line
(edit the file name for your
project)
iarbuild.exe "..\proj_cm7_0\[project-name].ewp" -make Debug - Select Build Order “Run before linking”.
- Click OK to close the Build Action dialog.
- Click the New button again.
- Paste the following command to build the CM7_1 project (if
applicable) in the Command line field as
single line (edit the file name for your
project)
iarbuild.exe "..\proj_cm7_1\[project-name].ewp" -make Debug - Select Build Order “Run before linking”.
- Click OK to close the
Build Action dialog.
The final list should look similar to this: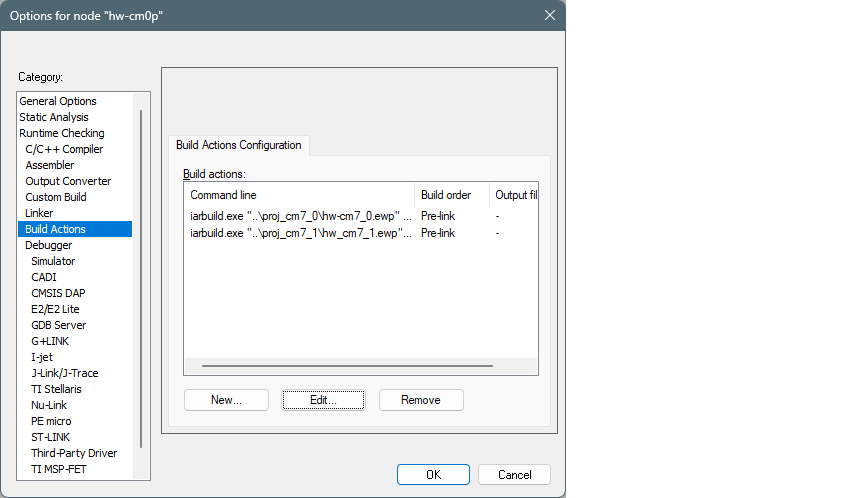
- Enable hex file generation. In the Runtime
Checking > Output Converter category:
- Select the Generate additional output check box.
- Ensure Output format is set to Intel Extended hex.
- Click OK, and then select
File > Save All to save all the changes.
- Build the project.
Configure CMSIS-DAP/I-jet debug options
- Create a session configuration file.
This is an xml file containing a projects list that should be launched in a multi-core debug session. The following shows an example for a triple-core device. For a dual-core device, remove the third partner node.
<?xml version="1.0" encoding="utf-8"?> <sessionSetup> <partner> <name>cm0</name> <workspace>C:\Users\mtw-multi-core\Multicore_App\multi-core_workspace.eww</workspace> <project>cm0</project> <config>Debug</config> <numberOfCores>1</numberOfCores> <attachToRunningTarget>false</attachToRunningTarget> </partner> <partner> <name>cm7_0</name> <workspace>C:\Users\mtw-multi-core\Multicore_App\multi-core_workspace.eww</workspace> <project>cm7_0</project> <config>Debug</config> <numberOfCores>1</numberOfCores> <attachToRunningTarget>true</attachToRunningTarget> </partner> <partner> <name>cm7_1</name> <workspace>C:\Users\mtw-multi-core\Multicore_App\multi-core_workspace.eww</workspace> <project>cm7_1</project> <config>Debug</config> <numberOfCores>1</numberOfCores> <attachToRunningTarget>true</attachToRunningTarget> </partner> </sessionSetup> - Configure multi-core debugging for the CM0+ project.
- Go to Project > Options -> Debugger.
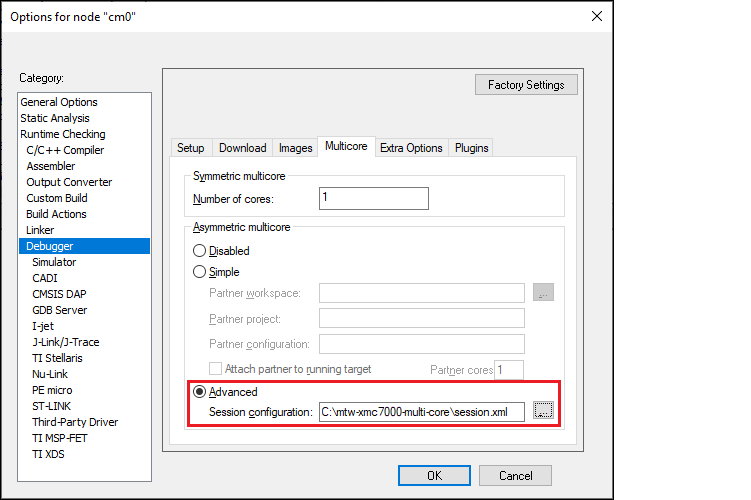
- Switch to the Multicore tab.
- Select the Advanced radio button and specify a path to the session configuration file in the Session configuration field.
- Click OK.
- Save the workspace.
Launch multi-core debug session with CMSIS-DAP/I-jet
Select the CM0 project and click the Download and debug button.
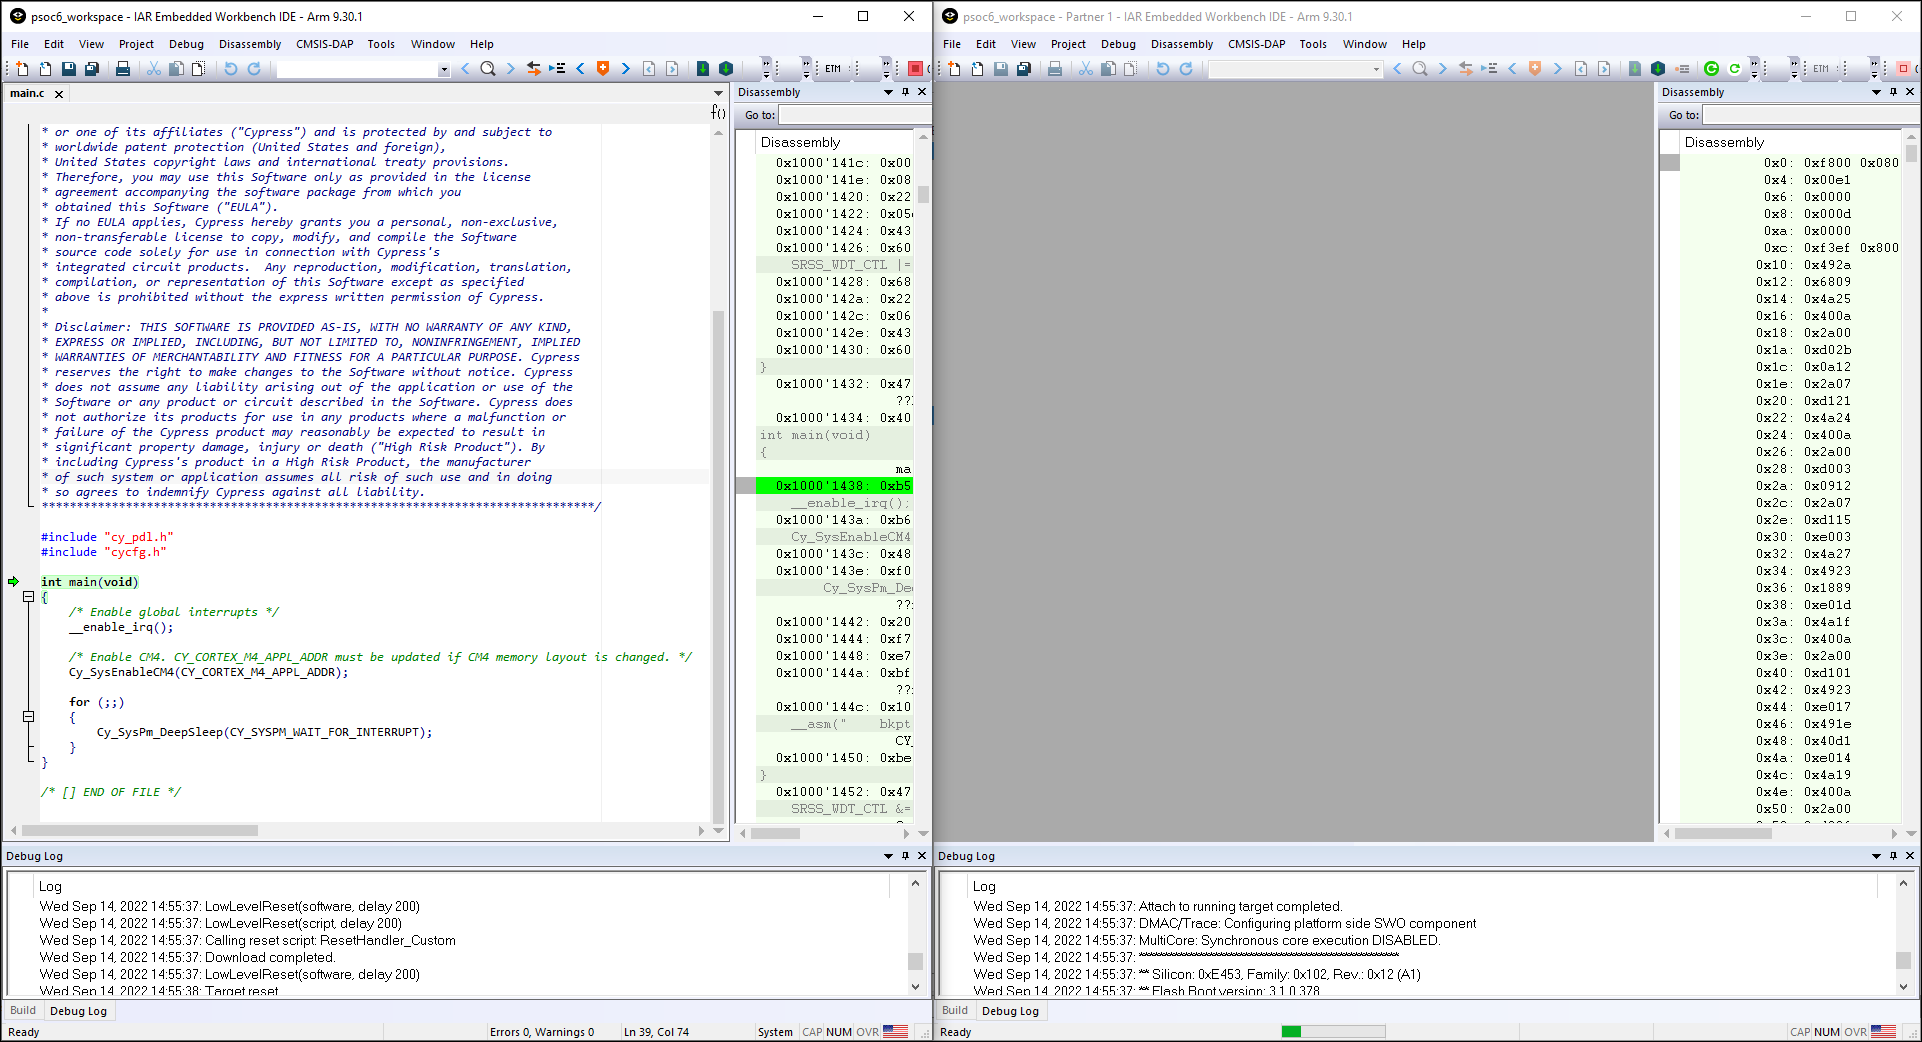
The left side of the screen shows the IAR IDE instance attached to the CM0+
core. The right side shows the CM4 (or CM7) core not started yet. Once the
Cy_SysEnableCM4() function is executed on the CM0+
core, the CM4/CM7 will start executing its application.
You can step through the code by switching back and forth between the two IAR IDE instances.
Launch multi-core debug session with J-Link
The IAR IDE does not have native support for the J-Link driver, which imposes some limitations:
IAR does not provide native multi-core debugging support when using a J-Link probe. This means that in order to launch multi-core debugging, you must open a few IAR IDE instances manually (one instance per core). Also, multi-core debugging with a J-Link probe lacks some features available with CMSIS-DAP and I-jet probes. Therefore, depending on the target probe, you need to configure projects slightly differently.
- IAR will not automatically open separate IDE instances for each core, so you need to do it manually.
- Some enhanced features are not available; see the Multi-core toolbar and CTI usage section for more details.
To launch multi-core debugging with J-Link:
- Open your multi-core IAR workspace in separate IDE instances (the
number of IDE instances should be equal to the number of cores on your MCU).
- Select the CM0+ project in the first IDE instance and click Download and Debug. The debugger will download all
images, reset the target, and halt at the beginning of the CM0+ project's
main(). - Switch to the other IDE instances and select: Project > Attach to Running Target.