SNR Measurement tab
The
SNR Measurement
tab allows measuring an SNR for individual sensors. It provides the user interface to acquire noise and signal separately and then calculates an SNR based on the captured data. The obtained value is then validated by a comparison with the required minimum (5 by default, can be configured in the Options dialog).
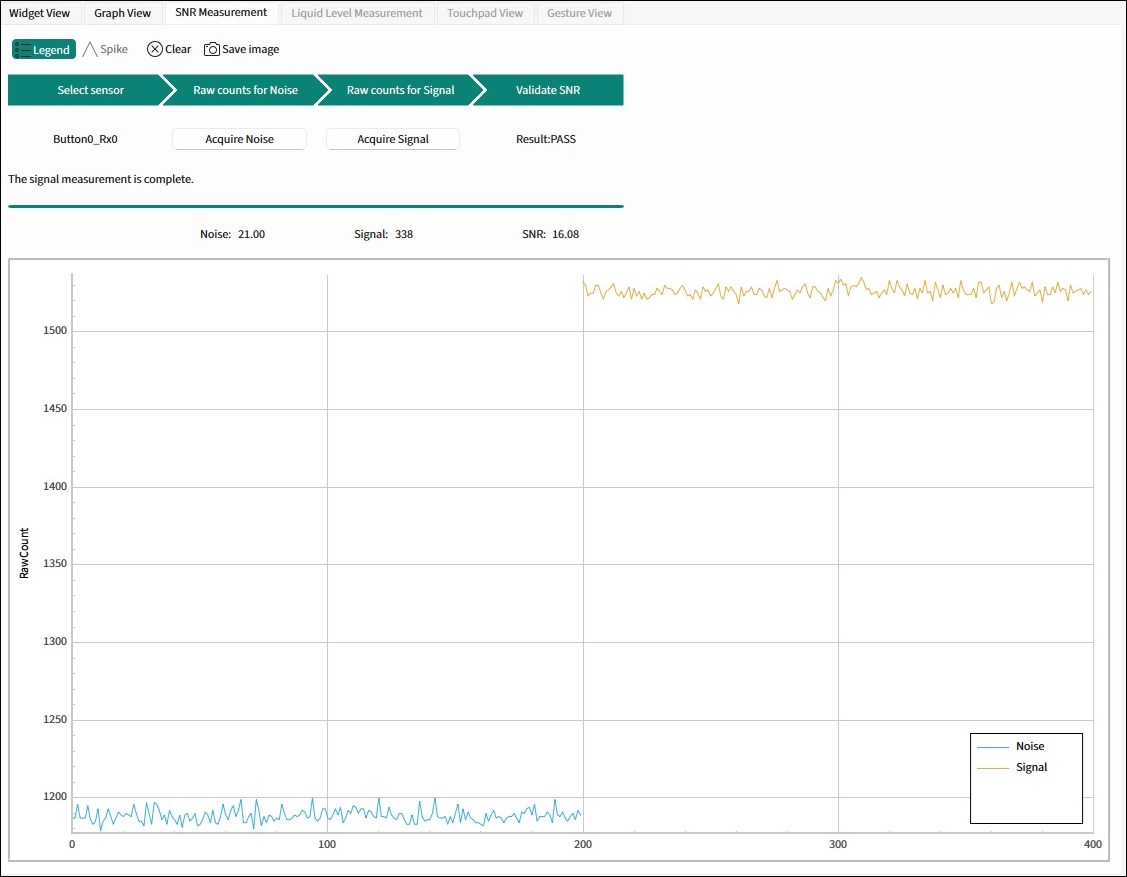
SNR Measurement procedure
Click
Connect
to the device and then
Start
communication on the toolbar.
Switch to the
SNR Measurement
tab.
Select the sensor by clicking it on the Widget Explorer pane and observe the
Select sensor
block become green.
Ensure no touch is present on the selected sensor.
Click
Acquire Noise
and wait for the required count of samples to be collected. Observe the
Raw counts for Noise
block become green after the action completes.
Observe the Noise parameter be updated with the calculated noise average value.
Touch the selected sensor to produce a signal on it.
Click
Acquire Signal
and wait for the required count of samples to be collected. Observe the
Raw counts for Signal
block become green after the action completes.
Observe the Signal parameter be updated with the calculated signal average value.
Observe the SNR parameter be updated with the SNR. The
Validate SNR
block becomes green if the result is PASS, if FAIL – red.
SNR measurement pane
The SNR Measurement procedure pane indicates the SNR measurement stages. The status is defined by the background color: green means the stage is successfully completed.
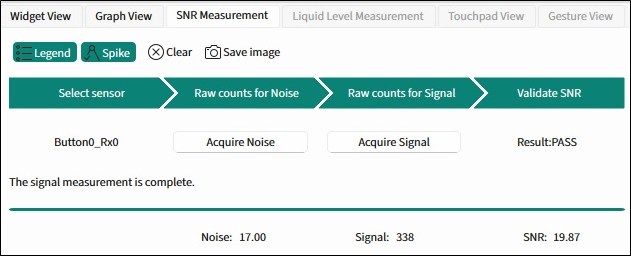
The progress bar provides graphical guidance to the user to complete the SNR measurement. The bar displays the progress and user-addressed relevant messages.
The measured noise, signal, and SNR values are displayed below the progress bar. The SNR value is calculated as Signal divided by Noise rounded up to 2 decimal points. The result has the following meaning:
PASS – The SNR is above the required limit (green).
FAIL – The SNR is below the required limit (red).
N/A – The SNR cannot be calculated because noise/signal samples are not collected yet (grayed out).
Graph chart (SNR)
The
Graph chart
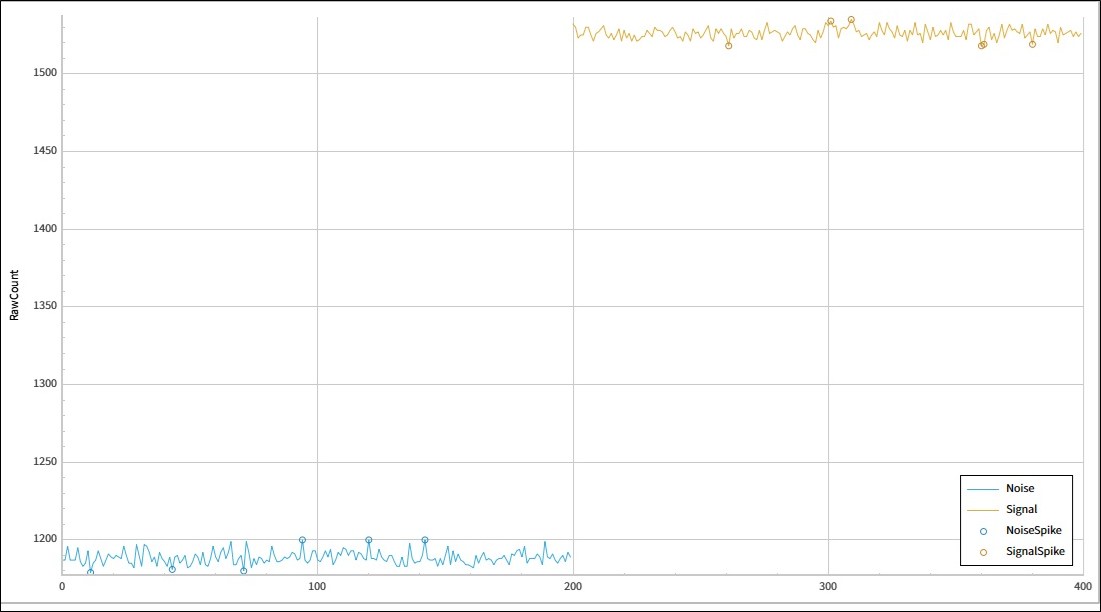
displays the measured sensor noise and signal. Noise and signal spikes displayed on the chart are the points ignored during the SNR calculation.
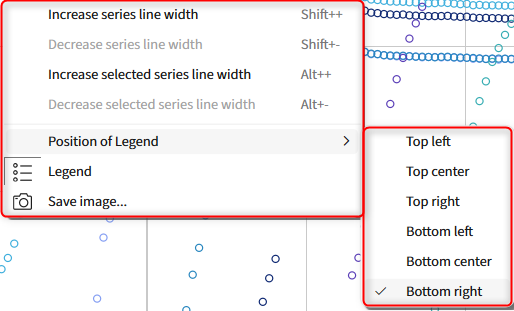
Click the
Legend
button to make it visible or invisible
Position of Legend
(six directions)
For a description of
Legend
,
Spike
,
Clear
, and
Save image
, go to the
Tabs toolbars
table.
SNR options
SNR parameters can be modified in the options dialog. See
Tuner Configuration options
for descriptions of other tabs on this dialog.
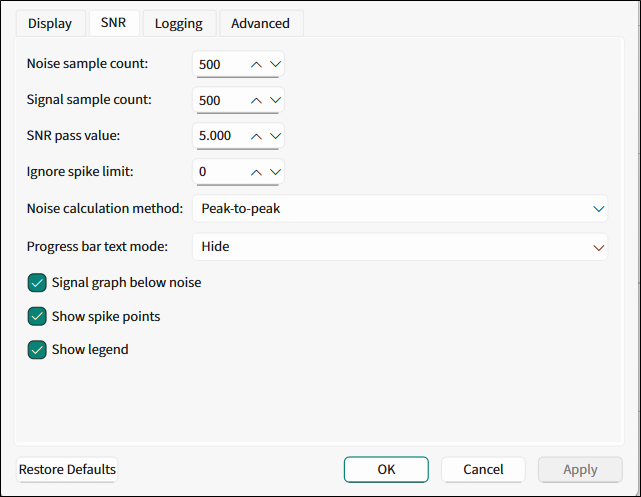
Fields:
Noise sample count – The count of samples to acquire during the noise measurement operation.
Signal sample count – The count of samples to acquire during the signal measurement operation.
SNR pass value – The minimal acceptable value of the SNR.
Ignore spike limit – Ignores a specified number of the highest and the lowest spikes at noise / signal calculation. That is, if you specify number 3, then three upper and three lower raw counts are ignored separately for the noise calculation and for the signal calculation.
Noise calculation method – Allows selecting the method to calculate the noise average. The following methods are available for selection:
Peak-to-peak (by default) – Calculates noise as a difference between the maximum and minimum value collected during the noise measurement.
RMS – Calculates noise as a root mean-square of all samples collected during the noise measurement.
Progress bar text mode – This label is shown with the progress bar:
Hide (by default) – No label.
Percent – The number of samples in percent acquired during the signal measurement operation.
Value – The number of samples acquired during the signal measurement operation.
Note:
This option is not available on Mac OS.
Signal graph below noise – Displays the signal series below the noise threshold on the graph.
Show spike points – Highlights the spike points on the graph.
Show legend – Shows the graph legend. The Legend has the context menu to change its position. Right-click the Legend to see the menu.