Graph chart (LL)
The
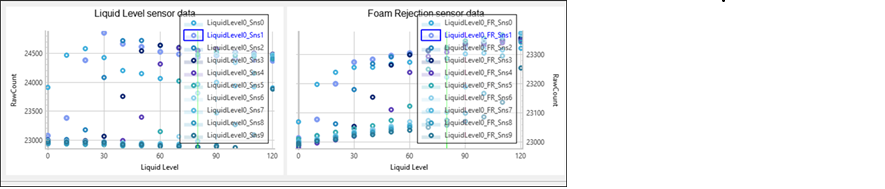
Graph
chart is empty until you start logging data and then the Liquid Level sensor data and Foam Rejection sensor data charts get populated with Liquid Level and RawCount parameters data.
The
Graph
chart is empty until you start logging data and then the Liquid Level sensor data and Foam Rejection sensor data charts get populated with Liquid Level and RawCount parameters data.