Evaluating simulations
Simulations are evaluated in InfineonSpice’s Waveform Viewer module by examining the plots from the simulated values.
To evaluate a simulation, you must have run it as described in
Running a simulation
. Doing so creates result files that Waveform Viewer can display.
Waveform Viewer has its own window outside the main
InfineonSpice
window:
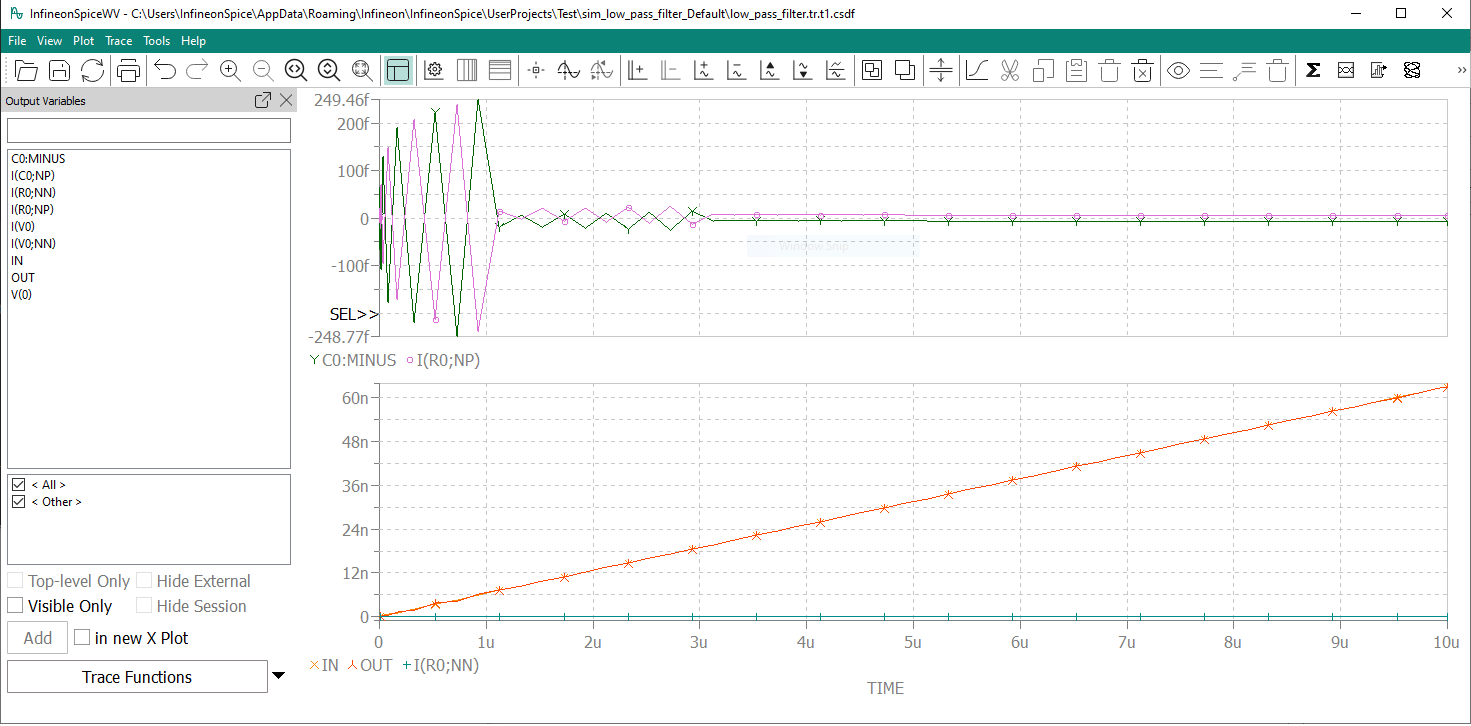
It contains a menu bar and toolbar across the top, the
Output Variables
view at the left (although it can be hidden) and the plots in the main part of the window. A plot is a rectangular diagram containing one or more traces (series of simulation result values), axes, and optionally annotations in the form of labels. The Waveform Viewer window can contain multiple plots, which are stacked vertically.
Note that, in results of AC analyses, each output variable is represented by two entries, one for the real component and one for the imaginary component.
Working with results
Usually, Waveform Viewer is automatically opened when the simulation is complete, displaying the simulation’s results. However, you can load other saved results using the
command. Simulation results are stored in subfolders of the project folder with the name
sim-
schematicName
-Default
in files whose names end in
.csdf
.
You can also open the saved waveform files in InfineonSpice by double-clicking the files in the simulation's result folder in the workspace. To open two files in one Waveform Viewer window, drag one file on top of the other in InfineonSpice.
If Waveform Viewer displays results and the result files on disk change, you can update the display using the
command.
Working with plots
When a simulation has been completed, Waveform Viewer displays the results in one plot. You can create additional plots, remove existing plots, and rearrange plots, as described in
Working with plots
.
The axes in plots can be dimensioned automatically or manually. It is also possible to add and remove y-axes when a plot contain multiple traces. See
Working with axes
for details.
Plots can also be annotated to emphasize aspects of interest or improve their comprehensibility, as described in
Working with annotations
.
Working with traces
Each plot contains one or more graphical representations of series of simulated values, so-called traces. You can add and remove traces, transfer traces between plots, and modify their appearance. For details, see
Working with traces
.