Working with axes
Each plot has a x-axis and one or more y-axes which indicate the values of the plotted data points.
The x-axis shows the time in the simulation when each value was calculated, and the y-axes show the size of the values. Each plot has one x-axis but can have multiple y-axes for multiple traces.
X-axis
The x-axis displays the simulation time. By default, there is one x-axis for all plots together. Zooming or scrolling a plot zooms and scrolls all other plots in the same way, ensuring that you can always readily compare the values in all traces.
Sometimes, this synchronization of
the x-axis may not be desired. In such cases, you can make the x-axis of each plot
independent from the others by choosing or clicking  in the toolbar.
If you want to assign a fixed
custom value range to a x-axis, you can select a plot that belongs to that x-axis
and choose or click  in the toolbar. This opens the Axis
Settings dialog, in which you can specify the end points and step
width of the axis, choose whether it is linear or logarithmic, and give the axis a
custom label.
in the toolbar. This opens the Axis
Settings dialog, in which you can specify the end points and step
width of the axis, choose whether it is linear or logarithmic, and give the axis a
custom label.
If you want to switch the axis between linear and logarithmic
display, you can do so in the Axis Settings dialog, as
described above, or click  in the toolbar. Note that an axis can only be switched to logarithmic display if it does not contain zero.
Selecting a y-axis
Some operations you can perform with y-axes or traces require you to select the desired y-axis first. To do so, simply click it. The currently selected y-axis is indicated by the text mark SEL>>. (The plot containing the axis is simultaneously selected for any plot-related operations, as described in Working with plots.)
The first axis is selected, the second one is not:

Multiple y-axes
When a plot is created, it has one y-axis. By default, the y-axis is sized automatically so that it covers the full range of the values in all traces In the plot.
One y-axis for all traces of a plot can mean that some traces are not very readable. For example, if one trace has an amplitude of 100 mA and the other just 3 mA, the second one will look very much like a horizontal line. To be able to meaningfully compare traces with greatly differing amplitudes, you can add separate y-axes for them.
To do so, select the
plot and choose or click  in the toolbar. The axis has default
settings. If you next add a trace to the plot (see Adding and removing traces for details) or move one there (see Moving traces), the trace is assigned to that axis and the axis is
automatically scaled for it.
in the toolbar. The axis has default
settings. If you next add a trace to the plot (see Adding and removing traces for details) or move one there (see Moving traces), the trace is assigned to that axis and the axis is
automatically scaled for it.
If a plot contains multiple y-axes, they are numbered consecutively, stating with zero. The trace listing below the plot is grouped by the axes to which each trace belongs. In this illustration, IN and V(O) are displayed according to axis 0, and I(VO) is displayed according to axis 1:
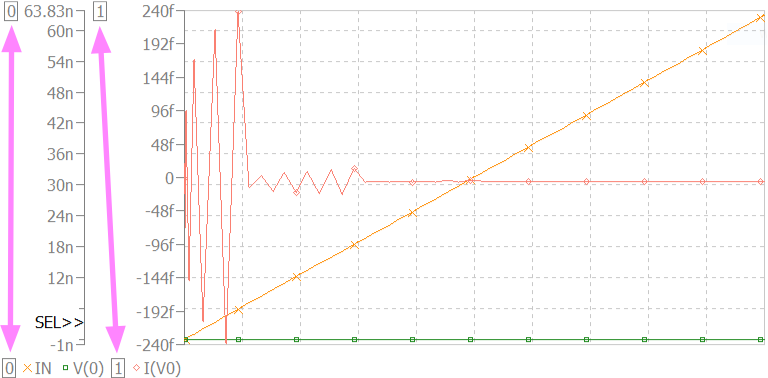
To assign a trace that belongs to one axis to another axis, select the target axis and drag the trace label from below the plot into the plot. In the example above, dragging the I(VO) label from below the plot into the plot would assign that trace to the 0 axis.
To delete a y-axis from
a plot, select it and choose or click  in the toolbar. Note that deleting an axis
also deletes all traces that are assigned to it. If you want to keep those traces,
assign them to another y-axis first, as described above.
in the toolbar. Note that deleting an axis
also deletes all traces that are assigned to it. If you want to keep those traces,
assign them to another y-axis first, as described above.
Custom y-axes
By default, a y-axis is automatically sized to accommodate the value range of the traces that belong to it, and it its resized when a new trace with a larger value range is added.
If you want to keep an axis at its current size even when more traces are added later, you can deactivate this automatic accommodation by unchecking the command.
If you want to assign a fixed custom value range to a
y-axis, you can select it and choose or click in the toolbar. This opens the Axis
Settings dialog, in which you can specify the end points and step
width of the axis, choose whether it is linear or logarithmic, and give the axis a
custom label.
If you want to switch the axis between linear and logarithmic
display, you can do so in the Axis Settings dialog, as
described above, or click  in the toolbar. Note that an axis can only be switched to logarithmic display if it does not contain zero.