Introduction
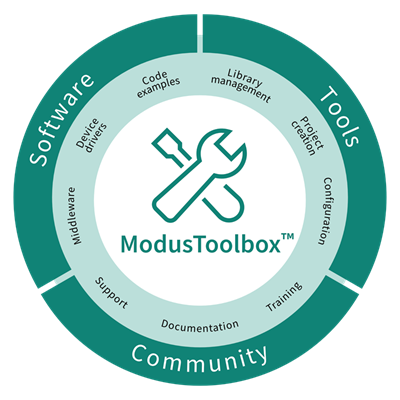
ModusToolbox™ software is a collection of GUI and non-GUI tools, libraries, and programs used to develop embedded applications.
Desktop tools are installed as part of the ModusToolbox™ Tools Package available from the Infineon Developer Center. Additional patches and packs are also available from the ModusToolbox™ Setup program and the Infineon Developer Center to supplement the base ModusToolbox™ tools installation. Run-time software is delivered via GitHub repositories during application creation and development. Learn more at ModusToolbox™ Software.
The documents in this collection are all part of the ModusToolbox™ ecosystem, including the tools package, programming tools, device information, and run-time software. This collection provides HTML versions of the PDF files provided on the web where possible.
