Multi-core debugging
Projects created for VS Code also provide debug configurations for multi-core applications. They support these probes:
KitProg3 onboard programmer
MiniProg4
J-Link (See Configure J-Link programmer/debugger settings )
Configurations
The configurations support debugging one core at a time and multiple cores as well. After the application has opened, there will be several configurations available for use in the
Run and Debug
tab of Activity Bar as shown.
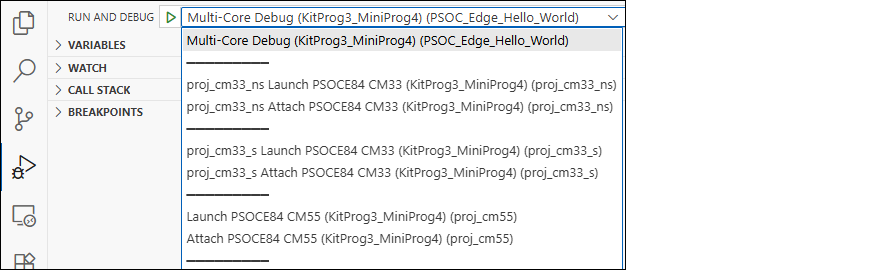
These include:
Multi-Core Debug
: programs multiple hex files, launches OpenOCD/J-Link GDB Server and starts multi-core debug session
Launch <device>
: launches debug session on the chosen core
Attach <device>
: attaches to the running core
In addition to these configurations, there is associated VS Code tasks available through the main menu
Terminal > Run Task
.
Erase Device
: erases all internal memory banks.
Program <application_name>
: downloads combined hex file into the flash.
Program <project_name>
: downloads project-specific hex file into the flash.
Erase All
: If present, erases all internal and external memories.
Launch the configuration
To launch multi-core debugging, run the
Multi-Core Debug
configuration. You will end up with a debug session containing two debug processes in CALL STACK view.
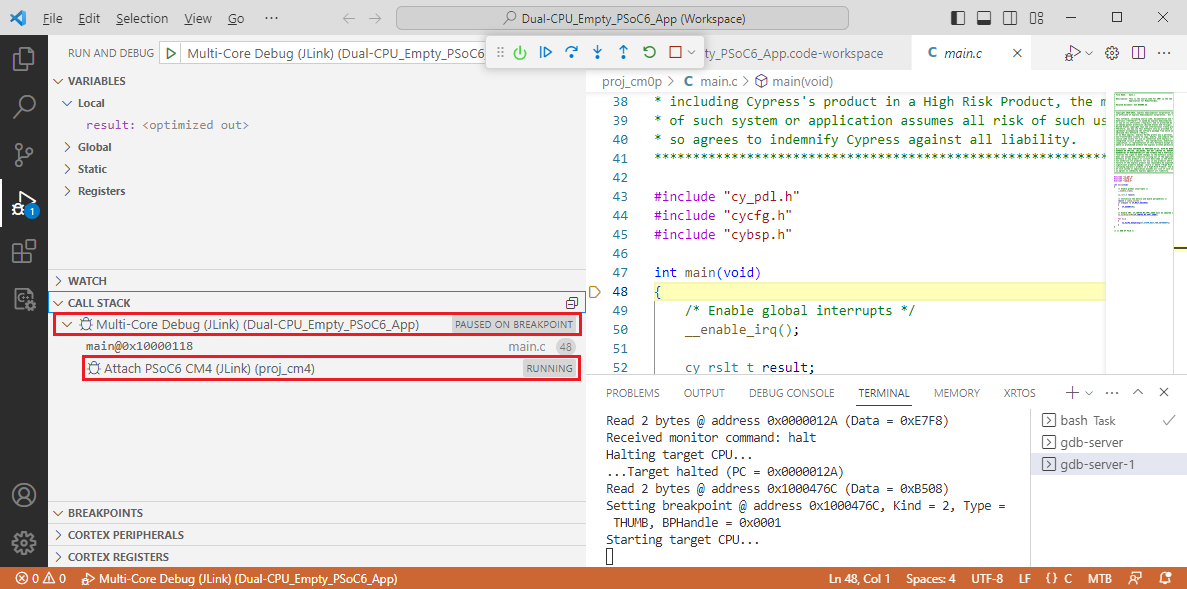
Once a session has started, the CM0+ core is halted at the beginning of
main()
, while the CM4 core is spinning in an endless loop in boot code, waiting for start. It will start and halt at
main()
as soon as the application running on the CM0+ executes the
Cy_SysEnableCM4()
function.
In the CALL STACK view you can observe two debug processes, each of them associated with a specific core. You can switch between the cores by selecting the appropriate process.
Note:
There is one limitation for XMC7000 MCUs. Before launching a multi-core debug session, you must program the MCU by launching the
Program Application
configuration.
Multi-core debug CM33 secure application booting from RRAM
When using multi-core debug CM33 secure applications booting from RRAM (for example PSOC_Edge_RTC_periodic_wakeup), you must configure the launch configuration to add the SMIF IP enabling commands.
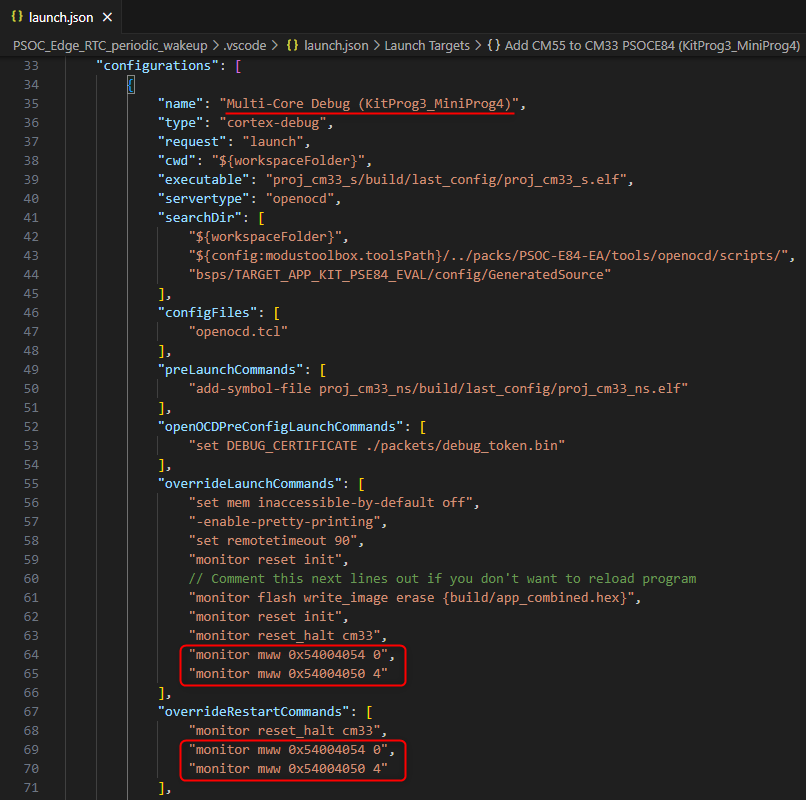
Add the following to overrideLaunchCommands and overrideRestartCommands parameters in
the "Multi-Core Debug" configuration:
For KitProg3/MiniProg4
monitor mww 0x54004054 0
monitor mww 0x54004050 4
For J-Link
monitor memU32 0x54004054=0
monitor memU32 0x54004050=4