Program/debug common
The VS Code GUI shows these launch configurations by default:
Launch : This builds the associated project, programs project-specific output file, and then starts a debugging session.
Attach : This starts a debugging session attaching to a running a target without programming or reset.
Erase Device : This erases all internal memories.
Erase All : If present, erases all internal and external memories.
Program : This builds the associated project, programs project-specific output file, and then runs the program.
Program
Open the main menu, select
Terminal > Run Task
. On the selection menu, select the "program" task.
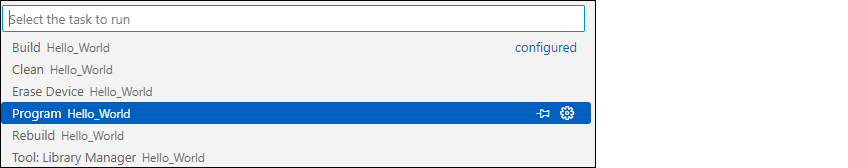
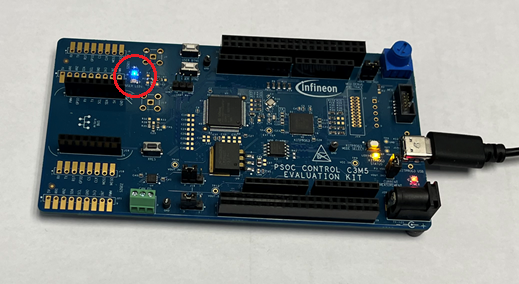
If needed, VS Code builds the application and messages display in the Terminal. If the build is successful, device programming starts immediately. If there are build errors, then error messages will indicate as such. When programming completes successfully, the LED will start blinking.
Debug
Select the
Run and Debug
icon in the VS Code Activity Bar, select the
Launch PSoC C3 CM33 (KitProg3_Miniprog4)
or
Launch PSoC C3 CM33 (JLink)
Launch Configuration, and click
Start Debugging
icon or press
F5
.


If needed, VS Code builds the application and messages display in the Console. If the build is successful, VS Code switches to debug mode automatically. If there are build errors, then error messages will indicate as such.
Changing programming interface SWD/JTAG
To change the target interface, update the application’s
bsp.mk
file by adding a make variable as shown (possible values are ‘swd’ and ‘jtag’).
MTB_PROBE_INTERFACE=swd
Then, regenerate launch configurations:
Update debugger serial number
If there are two or more debugger probes connected to your computer, the first detected probe will be used by default. There should not be more than one probe with the same serial number. Use this method if you want to use only one specific device. Use OS-specific tools to determine the serial number of connected USB devices.
Update application's
bsp.mk
file by adding variable below with the serial number specified, and regenerate launch configurations:
MTB_PROBE_SERIAL=0B0B0F9701047400
Add Live Watch
While debugging an application in VS Code, it is possible to add a Live Watch variable. This topic provides an example using the Hello World application.
Note:
Live Watch is not supported for multi-core applications.
Open the application's
launch.json
file, and locate the launch configuration. In this case "Launch PSoC C3 CM33 (KitProg3_MiniProg4)".
Scroll to the end of the configuration and add the following:
"liveWatch": {
                "enabled": true,
                "samplesPerSecond": 4
}
Open the
main.c
file and declare a global variable:
volatile int count = 0;Add the code to increment the variable every time the LED is blinking:
count++;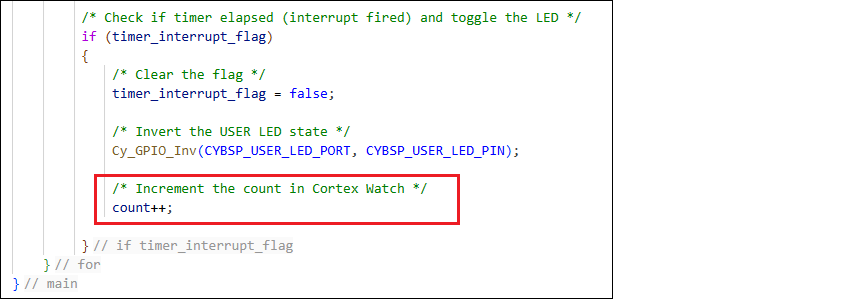
Launch a serial terminal such as PuTTY to monitor the output.
Note:
This step may only be required for applications that have output, such as Hello World.
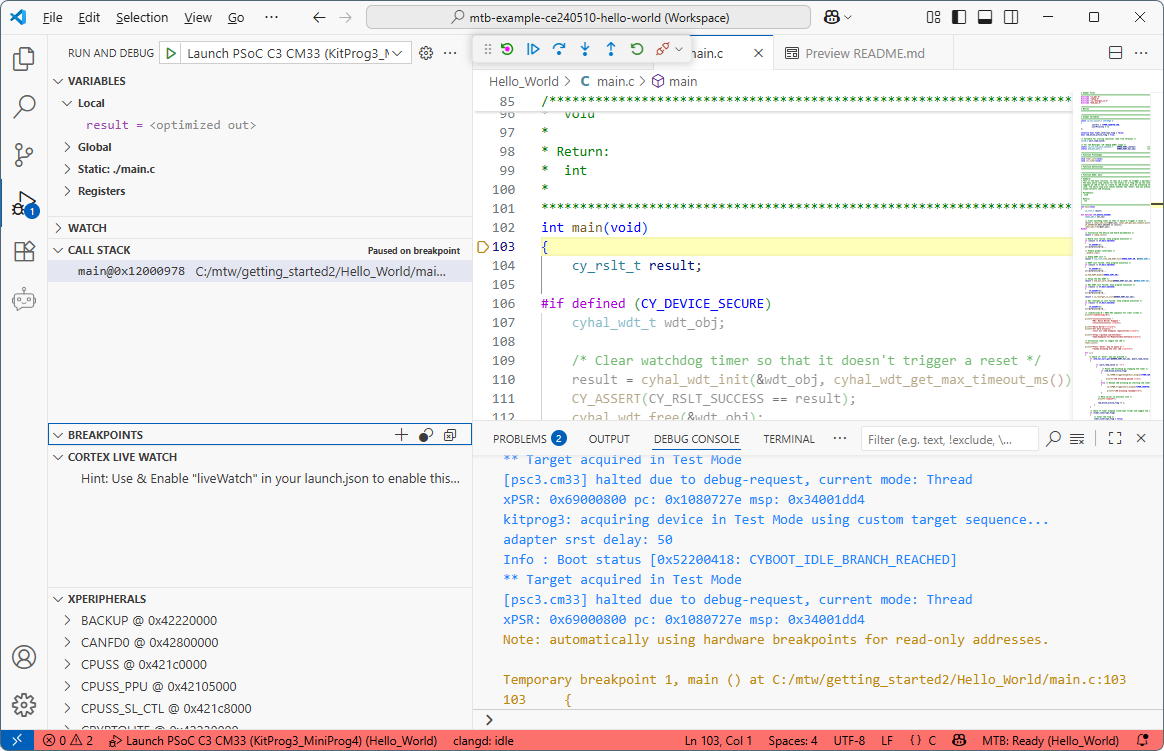
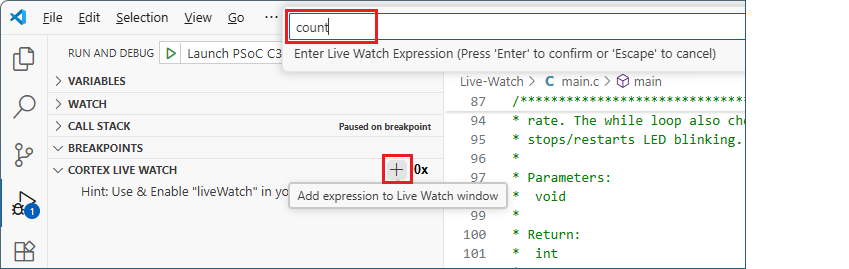
Start the debugger. When it stops at
main()
, add the
count
variable to the
CORTEX LIVE WATCH
section and press the [
Enter
] key.
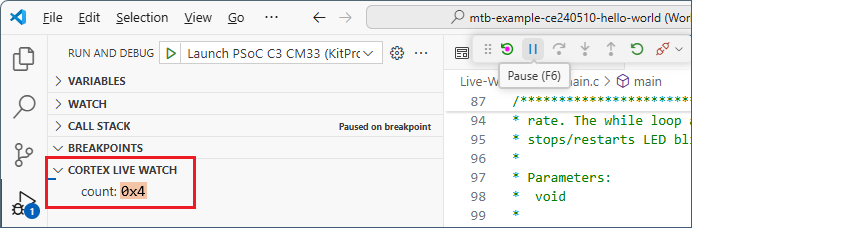
Check that the variable was added to the list and click on
Run/Continue
to proceed with debugging.
Observe that the variable's value increments as the code is running.
Add SEGGER SWO/RTT Grapher
You can use the SEGGER real-time transfer (RTT) to visualize the output of the target performed via the SWO pin. This section provides an example:
Start by adding the live watch described in the previous topic.
In the main.c file, add an include for the SEGGER RTT header file:
#include "SEGGER_RTT.h"Also, change the "count" global variable to
uint32_t
:
static uint32_t count = 0;Next, locate the main "for" loop. Insert these two lines directly before the loop:
SEGGER_RTT_Init();
SEGGER_RTT_ConfigUpBuffer(0, NULL, NULL, 0, SEGGER_RTT_MODE_BLOCK_IF_FIFO_FULL);
Then, inside the loop, update the
count=count+1;
line to add
CySysLib_Delay();
and
SEGGER_RTT_Write();
commands, as follows:
    for (;;)
    {
        Cy_SysLib_Delay(100);
        count=count+1;
        if(count%256==0)
        {
            count=0;
        }
        SEGGER_RTT_Write(0, &count, sizeof(count));

/* code continues */

    }
Manually add a new file in the deps directory named, segger-rtt.mtb, with the following content:
https://github.com/SEGGERMicro/RTT#master#$$ASSET_REPO$$/RTT/masterEdit the
.
cyignore
file with the following content:
# Segger RTT
$(SEARCH_RTT)/Examples
$(SEARCH_RTT)/Syscalls/SEGGER_RTT_Syscalls_IAR.c
Open the Library Manager and click
Update
, or run
make getlibs
to update the application and acquire the RTT library.
Open the
launch.json
file and, in the same "Launch" configuration where you added the live watch, and add the
rttConfig
configuration, as follows:
   "liveWatch": {
                "enabled": true,
            },
            "rttConfig": {
                "enabled": true,
                "address": "auto",
                "decoders": [
                    {
                        "label": "",
                        "port": 0,
                        "type": "graph",
                        "encoding": "unsigned",
                        "graphId": "count",
                        "scale": 1
                    }
                ]
            },
Then, add the
graphConfig
configuration:
"graphConfig": [
{
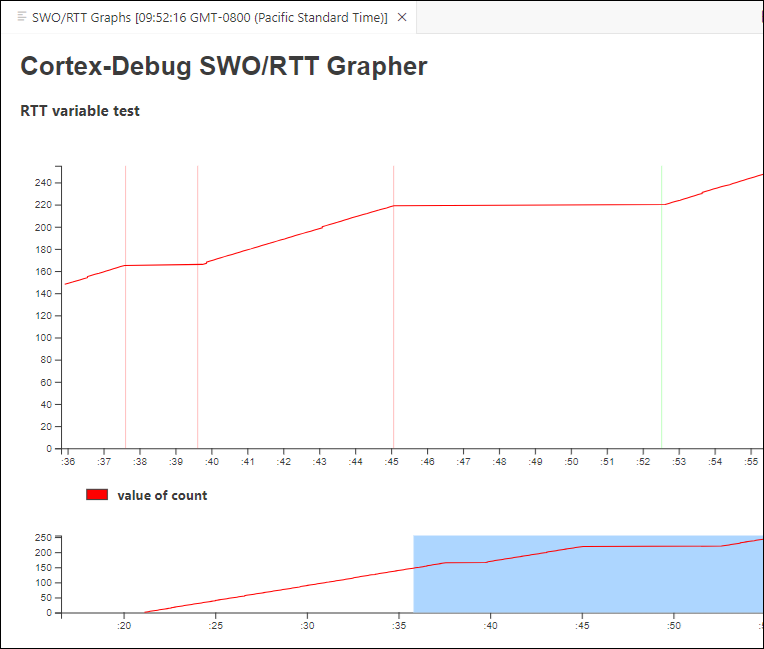
"label": "RTT variable test",
"timespan": 20,
"type": "realtime",
"annotate": true,
"maximum": 255,
"minimum": 0,
"plots": [
{
"graphId": "count",
"label": "value of count",
"color": "#FF0000"
}
]
}
]Save all files, start the debugger, and then click Continue.
VS Code will display the RTT grapher.