Program/Debug with J-Link
You can use a J-Link debugger probe to debug the application.
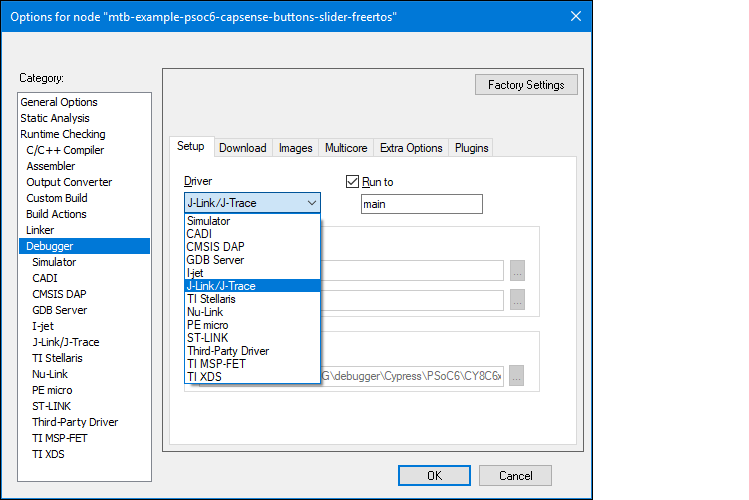
Open the Options dialog and select the
Debugger
item under
Category
.
Then select
J-Link/J-Trace
as the active driver:
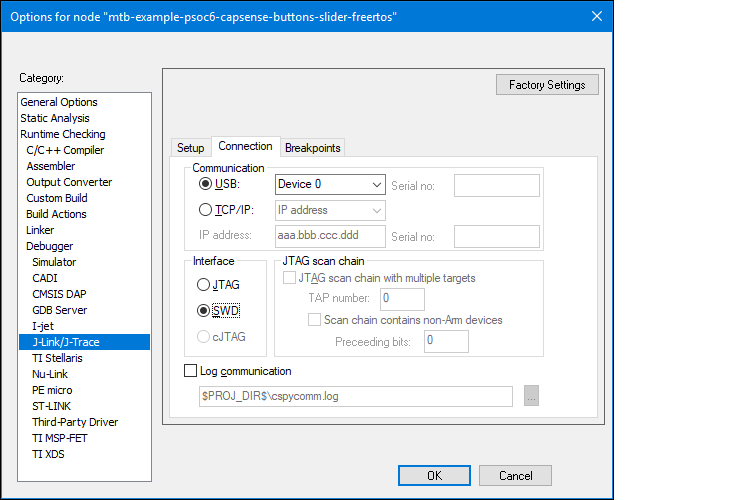
Select the
J-Link/J-Trace
item under
Category
, and under the
Connection
tab, switch the interface to
SWD
:
Connect a J-Link debug probe to the 10-pin adapter (this needs to be soldered on the prototyping kits).
Select
Project > Download and Debug
to launch the debugger.