Plot
Outputs are the signals that are plotted in the Waveform Viewer after the simulation. You can add more outputs after running the simulation, but specifying them upfront helps you see the important results immediately.
The following choices come up when you click
Plot
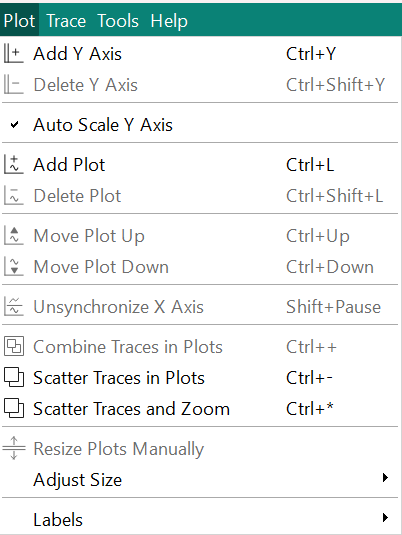
Add Y Axis
If you wish to add more variables to the same plot, you can add another Y Axis.
Delete Y Axis
Any additional y-axes added can be deleted with the
Delete Y Axis
command
Auto Scale Y Axis
Add Plot
Double click on any of the variables in the
Output Variables
window and the trace for the variable appears in the plot.
In addition, check the box
in new X Plot
and the new trace is depicted in a plot of its own and not combined with other plots.
Delete Plot
Move Plot Up/Move Plot Down
Button Move Plot Up or Move Plot Down the plot will move up or down independent of existing x-axes groups
If an x-axis group is empty it will be removed completely.
Move Plot Up
: The top most plot appears at the bottom
Move Plot Down
: The bottom most plot appears at the top
Unsynchronize X Axis
Use this command or select
 , to be able
to adjust width of individual axes. If synchronized, all widths have to be
the same of individual plots.
, to be able
to adjust width of individual axes. If synchronized, all widths have to be
the same of individual plots.
Combine Traces in Plots
The data series, depicted in the plots, if there is more than one, can be displayed in one x-axis and y-axis altogether.
Scatter Traces in Plots
If you have more than one trace and the traces are combined, in one single x-axis and y-axis plot, you can scatter or split them, each in their own plot.
Scatter Traces and Zoom
If you have more than one trace and the traces are combined, in one single x-axis and y-axis plot, you can scatter or split them, each in their own plot.
Resize Plots Manually
Select this command, and as soon as you reach an x-axis, the icon,
 appears. Click the icon and keep the mouse depressed while you pull the
axis as high or as low as you like.
appears. Click the icon and keep the mouse depressed while you pull the
axis as high or as low as you like.
Adjust Size
Height
,
Auto
and
Width
are three different actions which have different effects on the layout of plots.
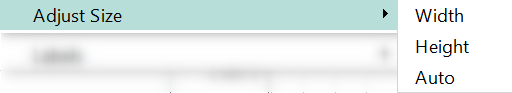
Height
adjusts the height of the plots within their synchronization group
Width
adjusts the width of the synchronization group (if they are next to each other and not above/below)
Auto
adjusts everything, so the synchronization groups and plots are all proportional
To enable the action
Width
, do the following:
Click on , uncheck Horiz. Unsynchronize X-Axis. Click OK
Add at least one other plot. uncheck Horiz. Unsynchronize X-Axis. Click OK
Now, when resizing the plots, the width of the synchronization groups can be changed
To enable
Height
there needs to be at least one synchronization group with at least two plots.
To enable
Auto
there need to be at least two plots.
Labels
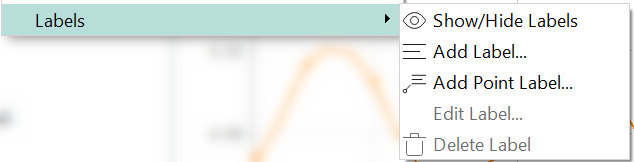
Show/Hide Labels
makes any labels visible or not visible. However, labels are created first by adding labels.
Select Add Label and a window opens where you can place your text. You can choose Rotate 0°, 90°, 180° or 270°. Align the text horizontally either Left,H.Center(horizontal center), Right. You can also align your text vertically being: Left,V.Center(horizontal center),Right. Select the bottom right block of the Label window to select font. The dropdown list gives a choice Choose font or Use default font. The default font is shown as MS Shell Dig 2

Ouput Variables
A list is here of all the possible variables that the simulation comprises.
Under the list of variables a sub menu facilitates the plot handling as well as the depiction of the variables in the box above.

Check the
Top-level Only
box to sort variables and show only the top-level variables.
When you have a number of plots and wish to see which variables are traced and remove any variables that are not included, check the box
Visible Only
When you want to add one of the variable traces in its own plot immediately, check the box
in new X Plot
, then any new trace will not be combined with any other.
Select a variable, click
Add
and you will get your plot named under the relevant plot.
Trace Functions
Underneath the output variables, all the trace functions can be found. Mathematical, analytical and statistical functions are available for you evaluation of the trace in the plot.
The big arrow/dropdown list next to the Trace Functions is a shortcut to some of the mathematical and statistical functions that would be required.
