Tools

Shortcuts
Click
Shortcuts
and
Keyboard Shortcuts
opens.
You can filter the large amount of data by Context or Description or per existing Shortcut. If you know what you are looking for, enter the text in the Filter field above the columns. The respective columns below the radio buttons contain:
Context indicates the topic where the shortcut is located
Description explains how to execute the shortcut
Shortcut for the desired outcome
You can enter new shortcuts in a field below the columns. Select the function you wish to edit. Enter your combination for example, alt, ctrl and shift keys and a symbol of your choice or whatever else you like and select
Assign
. The new shortcut for that function will be what you entered.
Edit the function with
Clear
. Select
Default
for the system assigned shortcut.
To reset all the edits you made, click
Restore Defaults
your edits will be replaced with the system assigned shortcuts.
To complete this field, click
OK
to keep your changes or
Cancel
if you decide not to make any changes.
Axis Settings
You can set up your x-axis and y-axis by adjusting the range as well as the steps. Labels for the x-axis and y-axis can be custom assigned or standard assigned. You can also have choose to have a grid with dots or lines in the background. Click Apply to see the outcome before you click OK to set the changes.
Options
In
Options
you can control
scrollbars
colour of your traces
how the coordinates appear on the trace Trace Mark Scheme
synchronize x-axes
show the grid in the background
size of the plot
Font
default behavior when closing the workspace - whether to save or not or ask before saving, are options on closing the programme
You can check the box Display output variable name and alias
Cursor
You can apply cursor settings to facilitate navigation and analysis. You can
Display Pointer
as a circle as well as
Display Cursor
which creates dotted lines so that various points on various plots can be seen easier.
Display Cursor
allows a small window to pop up and gives the coordinates of where your cursor is on the plot. As you move your cursor, the ruler moves and shows exact coordinates.
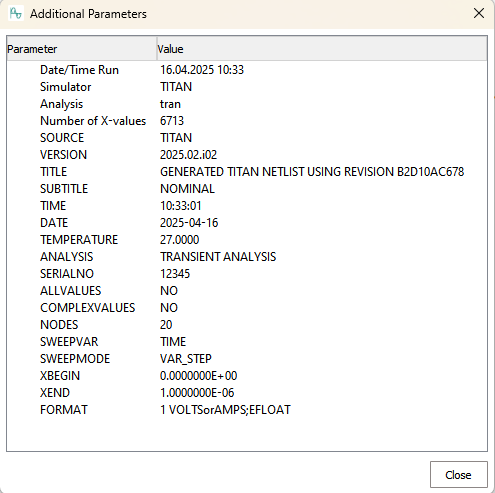
Additional Parameters
The image shows a list of all relevant parameters for the current plot.