Simulation Environment view
The Simulation Environment view provides detailed information about the setup used for simulations, which you can modify.
Simulation Profiles
Set a simulation profile in an open schematic. This can be Default of any other that has been created. The profile defines settings of your choice for electrical characteristics values in each of the components in the schematic.
Analyses
Select the desired analyses that you want the simulation to perform:
- Transient
- OP(operating points)
- DC(direct current)
- AC(alternate current)
At least one analysis must be selected.
Accuracy Parameters
set for
Relaxed
,
Standard
,
Enhanced
,
High
or
Extreme
according to the strictness required for your simulation. Set the
Temperature
range required.
Do not select
Skip initial bias point computation
unless you have specific reasons to do so. See the Titan User manual in the section about UIC (Use initial condition) for details.
Parameters
Additional parameters that are not listed in the Properties for the individual components can be added here.
Plot Setup
You can select how much detail for voltages and the currents to be displayed in the plots that are generated:
- All : Every voltage or current, including in subcircuits
- Top-level: Every voltage or current in the schematic itself, but not those in subcircuits
- Signals only: Only voltages or currents on the specified signal
You can specify which signals to be displayed in your plot. The signals are given in a list. Right-click the list to specify your signal choice. You can
- Delete Row(s): Excludes signals not required for your plot
- Select Output on Schematic: Select the schematic for the required signals to include in your plot
- Select Output on Schematic (differential): Select the schematic for the required signals to include in your plot
- Add Expression Any expression that you wish to plot can be created
Plot Mode
for your simulation, you can choose
- No plotting
- All outputs in one plot
- Every output in separate plot
If you deal with complex numbers, you can specify which signals to be displayed in your plot. The signals are given in a list.
Click on the
AC Modifier
and you have a number of points of analysis that can be selected on the schematic including:
- Magnitude, which you can select on the schematic to see magnitude of a particular element.
- dB20
- Phase
- Real part
- Imaginary part
Model Libraries
Choose the Library Path by placing the link the field Library Paths. A Library contains components. See Custom containers
Settings
You set
Floating Nodes
and
Relative Reference
in the Settings field.
Floating Nodes
: You can add a shunt resistor and select the size.
Relative Reference
: You can set how the relative reference value for the voltage/current-based integration error control is computed. The default value is 'Point Global'.
Additional Netlist Commands
Add any further commands as you wish in this window that you want in the simulation. Click on the icon

to create a netlist.
You can review the log messages generated during the simulation by clicking

.
Run a simulation
Refer to
Running a simulation
.
The following icons below the Simulation Environment window are shortcuts for the commands explained. Hover over them with your mouse to see what they command

Click either

or

to run the simulation.
You can switch between the two buttons by clicking the triangle in their lower-right corner and choosing the desired button from the menu that opens.
You run the simulation using the
button. This recreates the netlist and immediately runs the simulation. However, if you have already generated the netlist and edited it (as described in step
Running a simulation
), this overwrites your changes. In that case, use the
button which runs the simulation using the existing netlist, without recreating it first.
If a simulation runs too long, you can abort it by clicking

In this case, no simulation results are created and the Waveform Viewer is not opened.
Review the log messages generated during the simulation by clicking
.
Access the files generated by the simulation by clicking

.
Review the simulation results in the Waveform Viewer. If the Waveform Viewer does not open automatically, you can open it manually by clicking

.
Refer to
Workspace view
for information about Output
Messages
and
Log Summary
.
Open the Waveform Viewer with a selection in the Analyses section. If no selection is made in the Analyses section, a table appears after clicking on
, at which time you can then choose from what is
currently available. After you make a choice of one or several files
from the table as shown below, your waveform appears.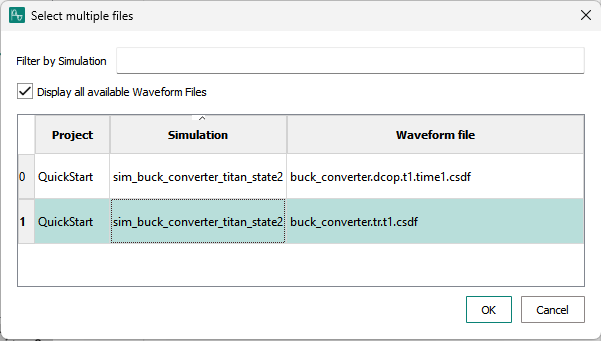
Refer to
Waveform viewer
.