Running a simulation
When a simulation has been set up, running it determines the schematic's electrical properties and displays them in graphs.
About this task
Running a simulation lets you determine how the schematic behaves over time under the configured conditions.
Before you begin
Procedure
- Start the simulation by clicking
 in
the action bar at the bottom of the Simulation Environment
view.
in
the action bar at the bottom of the Simulation Environment
view.InfineonSpice creates a netlist from the schematic and simulates it using the settings in the active simulation profile.
When the simulation is complete, it opens Waveform Viewer. The simulated results are shown as separate traces together in one plot.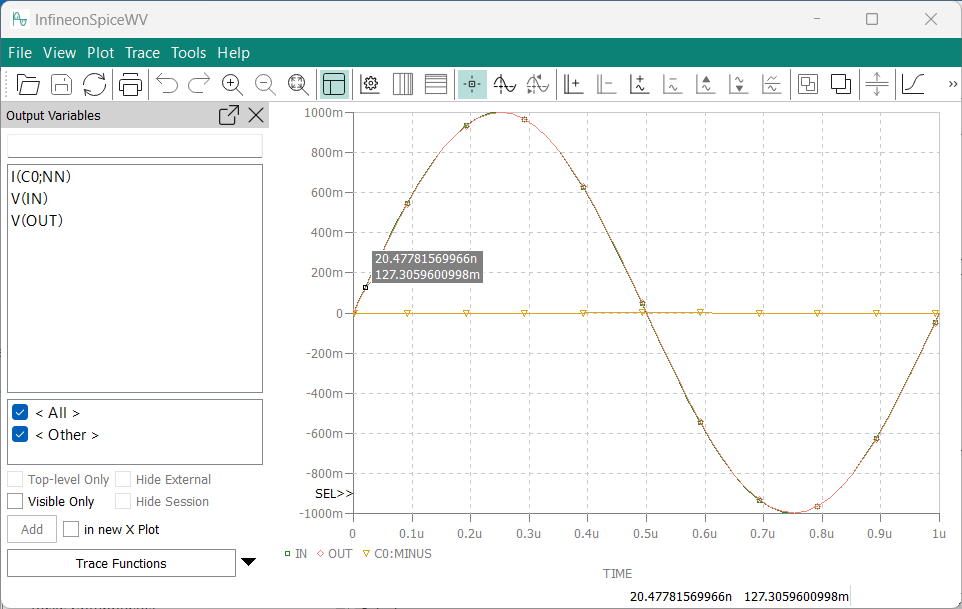
- On the Waveform Viewer’s toolbar, click
 .
.This separates the traces into individual plots. Among other things, this gives each plot a separate y-axis (while retaining a common x-axis for all plots) so that you can more easily see traces with comparatively small amplitudes.
If you want to combine the traces again, you can click
 .
.
Results
In addition to the traces you can see and work with in the Waveform Viewer, InfineonSpice has generated additional output:
The Output view’s Messages tab contains a list of status messages that were generated while executing the simulation.
These messages are typically of little interest in analyzing the schematic but may be helpful when looking for the sources of unexpected results or outright errors. Understanding them may require technical knowledge of the SPICE simulation engine.
The netlist, waveforms, and logs that were generated in running the simulation are saved to disk and are available in the project folder in the Workspace view.
The name of the folder begins with “sim_”, which is followed by the name of the project and the name of the simulation profile that you used. For example, a folder may be named “sim_myProject_myProfile.” When you run a simulation again with the same profile, any previous results are overwritten without warning.
If you double-click a log file in the Workspace view, it opens in the Output view’s Log Summary tab. You can filter the tab’s content by message category.