Program/debug
This section covers various aspects of programming and debugging using VS Code:
- Program/debug common
- Program/debug using KitProg3/MiniProg4
- Program/debug using J-Link
- Multi-core debugging
- Program/debug secure configuration devices
Program/debug common
The VS Code GUI shows these launch configurations by default:
-
Launch : This builds the associated project, programs project-specific output file, and then starts a debugging session.
-
Attach : This starts a debugging session attaching to a running target without programming or resetting.
-
Erase Device : This erases all internal memories.
-
Erase All : If present, erases all internal and external memories.
-
Program : This builds the associated project, programs project-specific output file, and then runs the program.
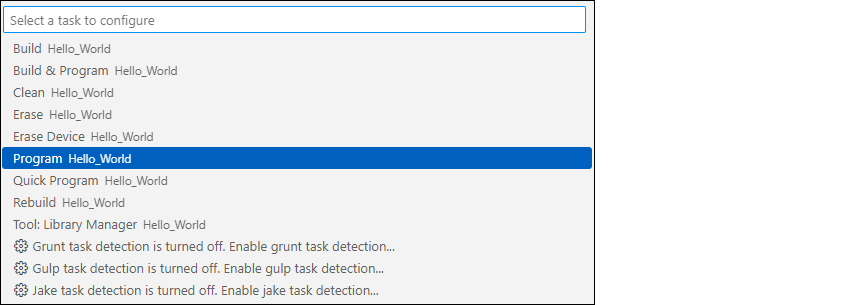
Program
Open the main menu, select Terminal > Run Task. On the selection menu, select the "program" task.
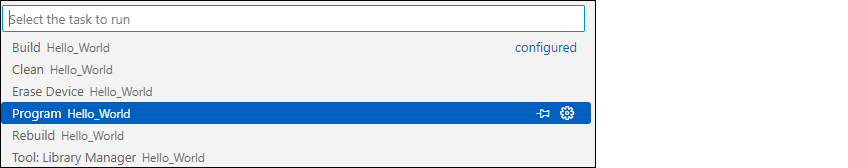
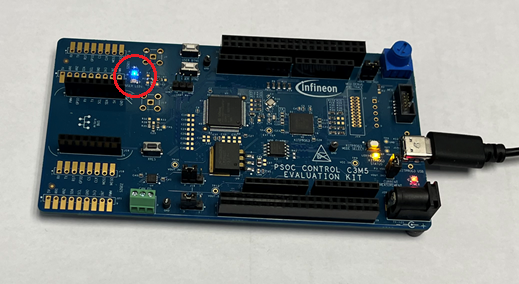
If needed, VS Code builds the application and messages display in the Terminal. If the build is successful, device programming starts immediately. If there are build errors, then error messages will indicate as such. When programming completes successfully, the LED will start blinking.
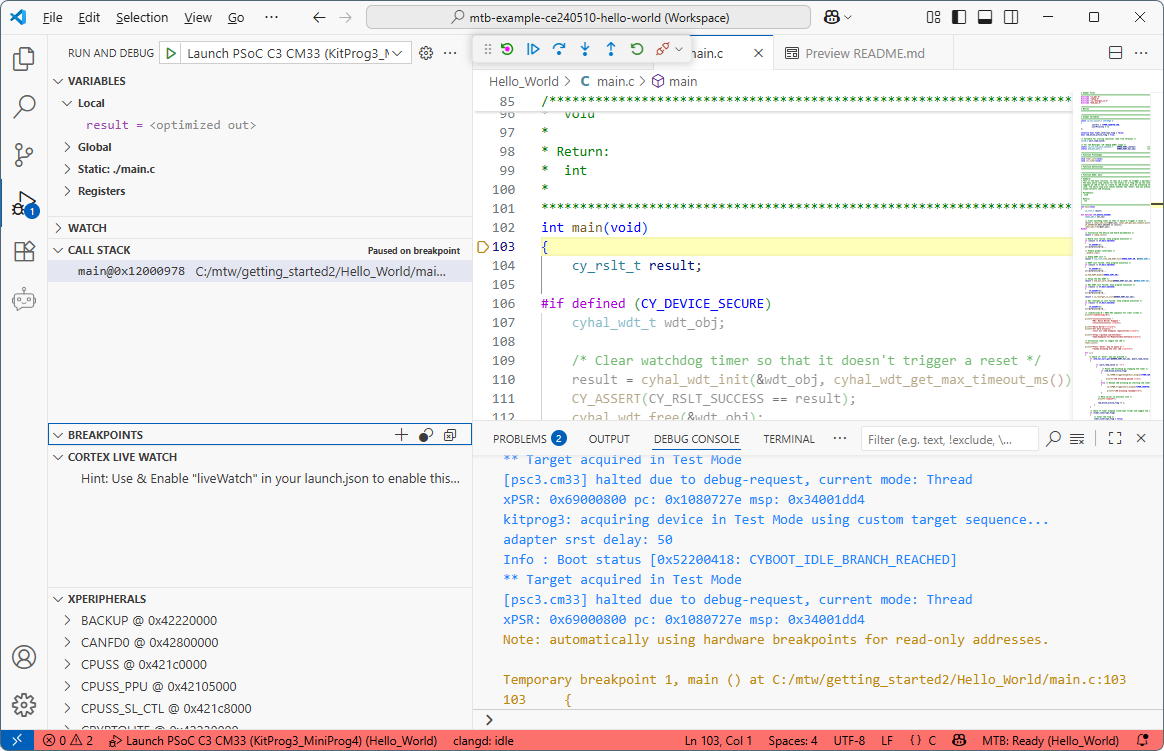
Debug
Select the Run and Debug icon in the VS Code Activity Bar, select the Launch PSoC C3 CM33 (KitProg3_Miniprog4) or Launch PSoC C3 CM33 (JLink) Launch Configuration, and click Start Debugging icon or press F5.
![]()
![]()
If needed, VS Code builds the application and messages display in the Console. If the build is successful, VS Code switches to debug mode automatically. If there are build errors, then error messages will indicate as such.
Changing programming interface SWD/JTAG
To change the target interface, update the application’s bsp.mk file by adding a make variable as shown (possible values are ‘swd’ and ‘jtag’).
MTB_PROBE_INTERFACE=swd
Then, regenerate launch configurations:
Update debugger serial number
If there are two or more debugger probes connected to your computer, the first detected probe will be used by default. There should not be more than one probe with the same serial number. Use this method if you want to use only one specific device. Use OS-specific tools to determine the serial number of connected USB devices.
Update application's bsp.mk file by adding variable below with the serial number specified, and regenerate launch configurations:
MTB_PROBE_SERIAL=0B0B0F9701047400
Add Live Watch
While debugging an application in VS Code, it is possible to add a Live Watch variable. This topic provides an example using the Hello World application.
Live Watch is not supported for multi-core applications.
-
Open the application's launch.json file, and locate the launch configuration. In this case "Launch PSoC C3 CM33 (KitProg3_MiniProg4)".
-
Scroll to the end of the configuration and add the following:
    "liveWatch": {
                    "enabled": true,
                    "samplesPerSecond": 4
    }
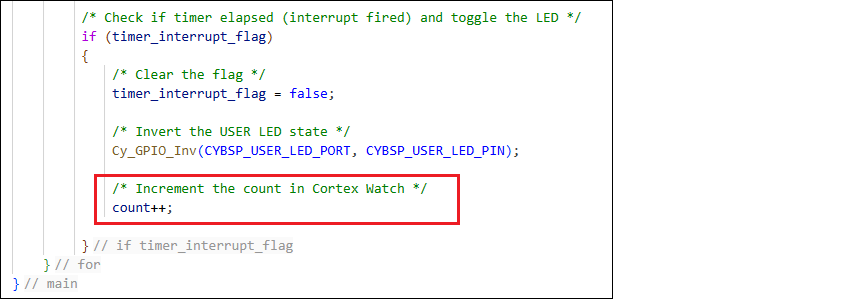
- Open the main.c file and declare a global variable:
volatile int count = 0;
- Add the code to increment the variable every time the LED is blinking:
count++;
-
Launch a serial terminal such as PuTTY to monitor the output.
Note: This step may only be required for applications that have output, such as Hello World.
-
Start the debugger. When it stops at
main(), add thecountvariable to the CORTEX LIVE WATCH section and press the [ Enter ] key.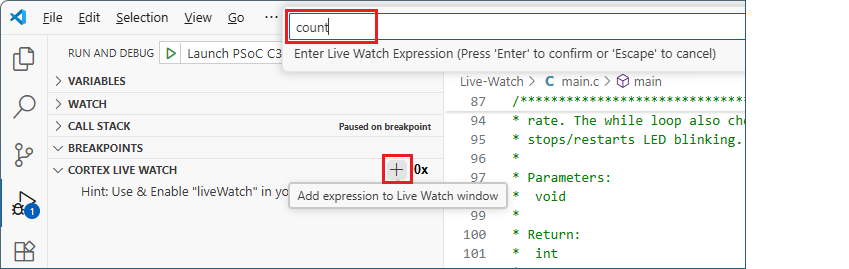
-
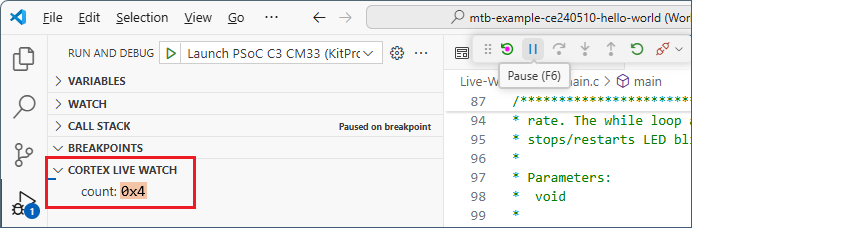
Check that the variable was added to the list and click on Run/Continue to proceed with debugging.
-
Observe that the variable's value increments as the code is running.
Add SEGGER SWO/RTT Grapher
You can use the SEGGER real-time transfer (RTT) to visualize the output of the target performed via the SWO pin. This section provides an example:
-
Start by adding the live watch described in the previous topic.
-
In the main.c file, add an include for the SEGGER RTT header file:
#include "SEGGER_RTT.h"
- Also, change the "count" global variable to
uint32_t:
static uint32_t count = 0;
- Next, locate the main "for" loop. Insert these two lines directly before the loop:
    SEGGER_RTT_Init();
    SEGGER_RTT_ConfigUpBuffer(0, NULL, NULL, 0, SEGGER_RTT_MODE_BLOCK_IF_FIFO_FULL);
- Then, inside the loop, update the
count=count+1;line to addCySysLib_Delay();andSEGGER_RTT_Write();commands, as follows:
        for (;;)
        {
            Cy_SysLib_Delay(100);
            count=count+1;
            if(count%256==0)
            {
                count=0;
            }
            SEGGER_RTT_Write(0, &count, sizeof(count));

    /* code continues */

        }
- Manually add a new file in the deps directory named, segger-rtt.mtb , with the following content:
https://github.com/SEGGERMicro/RTT#main#$$ASSET_REPO$$/RTT/main
- Edit the . cyignore file with the following content:
    # Segger RTT
    $(SEARCH_RTT)/main/Examples
    $(SEARCH_RTT)/main/Syscalls/SEGGER_RTT_Syscalls_IAR.c
-
Open the Library Manager and click Update , or run
make getlibsto update the application and acquire the RTT library. -
Open the launch.json file and, in the same "Launch" configuration where you added the live watch, and add the
rttConfigconfiguration, as follows:
                "liveWatch": {
                    "enabled": true,
                },
                "rttConfig": {
                    "enabled": true,
                    "address": "auto",
                    "decoders": [
                        {
                            "label": "",
                            "port": 0,
                            "type": "graph",
                            "encoding": "unsigned",
                            "graphId": "count",
                            "scale": 1
                        }
                    ]
                },
- Then, add the
graphConfigconfiguration:
                "graphConfig": [
                    {
                        "label": "RTT variable test",
                        "timespan": 20,
                        "type": "realtime",
                        "annotate": true,
                        "maximum": 255,
                        "minimum": 0,
                        "plots": [
                            {
                                "graphId": "count",
                                "label": "value of count",
                                "color": "#FF0000"
                            }
                        ]
                    }
                ]
-
Save all files, start the debugger, and then click Continue .
VS Code will display the RTT grapher.
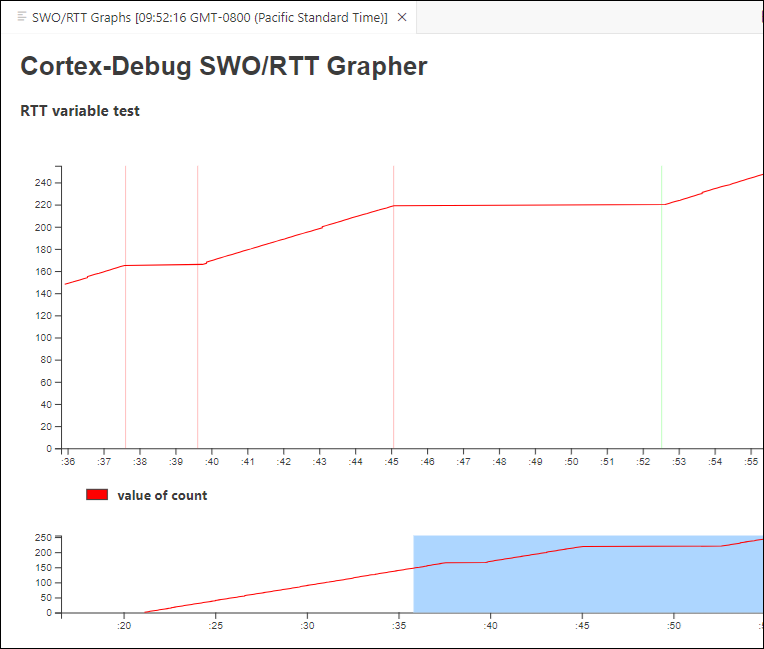
See https://community.infineon.com/t5/ModusToolbox/Using-Segger-RTT-library-in-ModusToolbox/td-p/965434 for expanding instructions for this example. To learn more about SEGGER RTT support, review these links:
- https://github.com/Marus/cortex-debug/wiki/SEGGER-RTT-support
- https://github.com/Marus/cortex-debug/wiki/SWO-Output#output-graphing-graphing
- https://github.com/SEGGERMicro/RTT.git
BMI for XMC1xxx/4xxx devices
XMC1xxx/4xxx devices use the Boot Mode Index (BMI) value to determine their boot mode and debug configuration after power-up. This value is stored in flash config sector 0.
The default boot mode is either:
-
ASC_BSL (Bootstrap Loader) - for new, out-of-the-factory, devices. This mode allows erasing and programming flash via UART or SPI interface using the onboard J-Link Lite debugger and legacy Infineon tools, but does not allow programming and debugging in ModusToolbox™ and using the standalone J-Link debugger.
-
SWD0 (Serial Wire Debug via Channel 0) - for Infineon kits, like XMC1100 Boot Kit. This mode allows any flash operations and debugging via the SWD interface.
There are several other modes, including using different channels (pins), SPD protocol, and flash protection scheme, which you may want to activate (switch to) during the development and production life cycles.
Refer to the following documentation for more details about BMI implementation and usage for XMC1xxx/4xxx devices.
- Boot Mode Index (BMI) XMC��™ microcontrollers
- Tooling - Boot mode options XMC4000
- AN_201511_PL30_005 - Boot mode handling for XMC1000
- XMC1100 AB-Step Reference Manual
- SEGGER KBA - Infineon XMC1000: BMI - Boot Mode Index
Switching BMI with the onboard J-Link Lite debugger
With the on-board J-Link Lite debugger, you can switch the BMI using the SEGGER J-Link Commander tool, which is a part of the J-Link Software Pack that must be installed to use XMC1xxx/4xxx in ModusToolbox™.
-
Connect the XMC™ Kit to USB and start J-Link Commander.
-
In J-Link Commander, connect to the target device, providing its name and specifying the SWD interface.
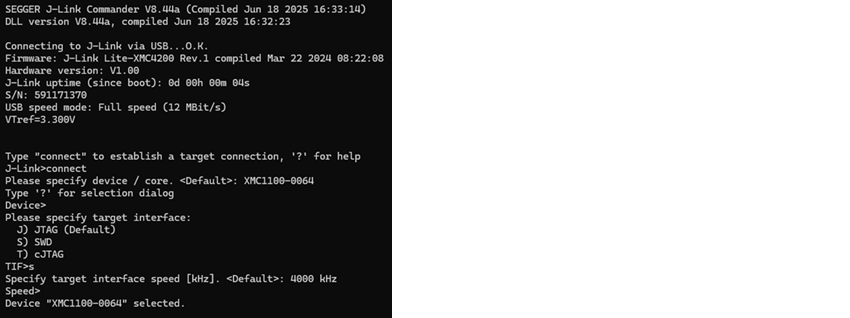
-
Use GetBMI command to obtain the current BMI.
-
Use SetBMI command without parameters to list all Boot Mode Indexes.
-
Use SetBMI [index] command to set switch to desired BMI.
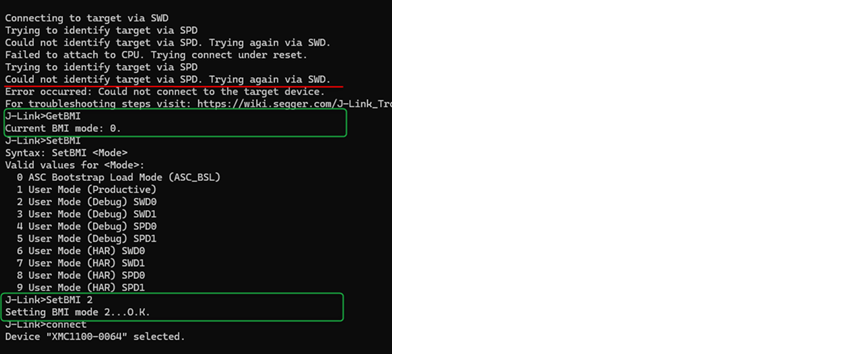
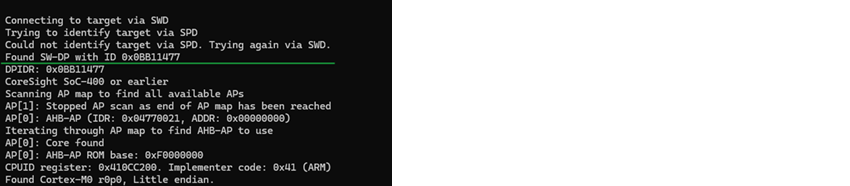
The debugger is now able to connect and identify the target after switching the BMI.
Switching BMI with stand-alone J-Link debugger
Stand-alone J-Link debuggers will automatically switch the BMI mode from ASC_BSL to SWD0 on target connection.
No additional steps required for programming and debugging in ModusToolbox™ if Channel 0 is used for debug pins (SWDIO - P0.14, SWCLK - P0.15).
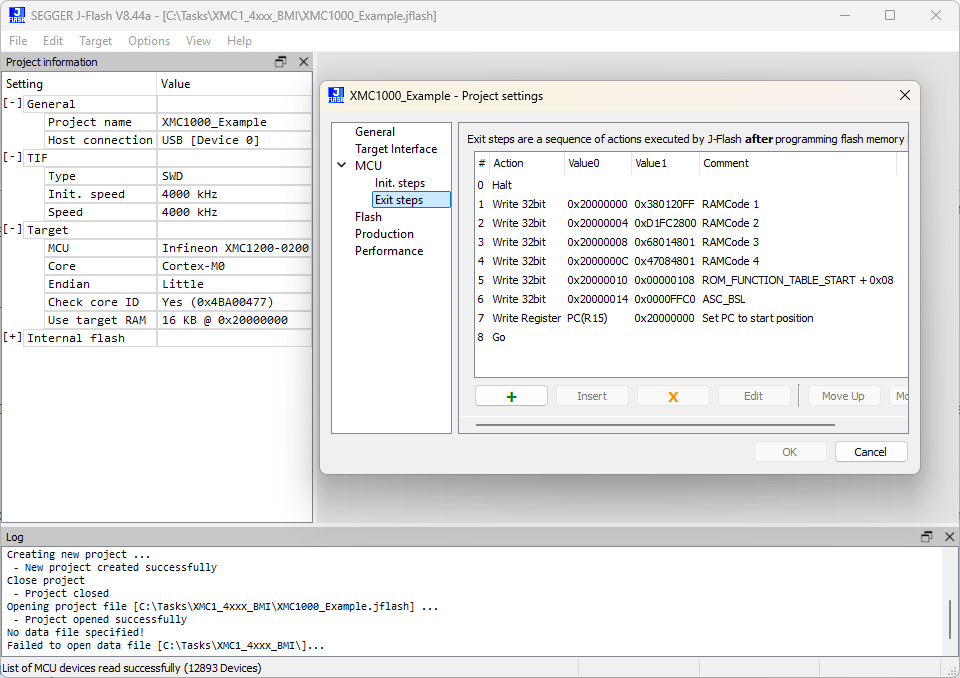
If a BMI other than SWD0 is required, you can use one of three *.pex scripts (ASC_BSL to SWD1, ASC_BSL to SPD0, and ASC_BSL to SPD1) available in SEGGER’s KBA. You can also use the J-Flash tool, where the desired BMI mode can be applied after programming, like in the example project file.
Program/debug using KitProg3/MiniProg4
Most PSOC™-based kits use KitProg3/MiniProg4 as the default programmer/debugger, so there is nothing to configure for them.
Connect the Kit
Follow the instructions provided with the kit to connect it to the computer with the USB cable.
KitProg Firmware Loader
The PSOC™ MCU kits include on-board programmer/debug firmware, called KitProg. KitProg3 is the latest firmware version. However, some older kits come with KitProg2 firmware installed, which does not work with the ModusToolbox™ software and you must update them to KitProg3. KitProg3 provides the CMSIS-DAP (Bulk) protocol by default, which is up to ~2.5 times faster than the CMSIS-DAP (HID) protocol. Both modes can be used via OpenOCD.
To update it, use the ModusToolbox™ Programmer GUI or the fw-loader CLI tool. Both are provided with the ModusToolbox™ Programming tools package available from the Setup program.
For more details about these tools, refer to the ModusToolbox™ Programmer GUI user guide or the Firmware Loader user guide.
On a Linux machine, you must run the udev_rules\install_rules.sh script before the first run of the fw-loader.
Supplying power with KitProg3_MiniProg4
If using the KitProg3 connector on a kit, power is generally supplied by the host PC. When using a MiniProg4, power is not supplied via the MiniProg4 by default. It is expected that the target MCU will be powered externally. However, the MiniProg4 does provide the ability to supply power to the target MCU.
Verify the voltage range supported by the target MCU, since it can be damaged by supplying unsupported voltage. Make sure that your MCU is not powered externally before supplying power via the KitProg3_MiniProg4 launch configuration. This supply is limited to approximately 200 mA and is protected against excess current draw. You can select 1.8 V, 2.5 V, 3.3 V, or 5 V.
Turning power supply on
Debug session
To turn power supply on during a debug session, edit the Launch configurations:
-
Open the Run and Debug view, select the launch configuration to be modified, and click the gear icon that opens the selected launch configurations in launch.json file.

-
Look for the
openOCDPreConfigLaunchCommandsproperty. If it is not present, add it. Update the property to include the following value:
"set ENABLE_POWER_SUPPLY <mV>"
Where [mV] defines target voltage in millivolts. For example:
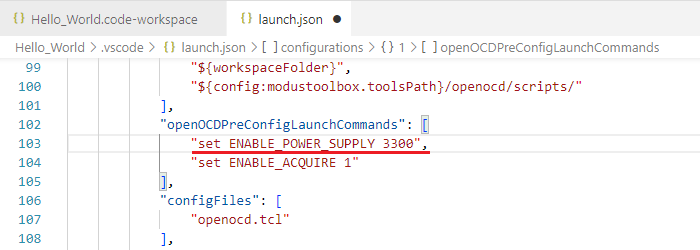
- Save the changes to the file.
Programing or erasing
To turn power supply on when programing or erasing, edit the Task configurations:
-
On the main menu, select Terminal > Configure Task... .
-
On the dialog, select the task to be modified, which opens the tasks.json file to that task.
-
Update the task to add the following value to the
argsproperty:
_MTB_RECIPE__OPENOCD_INTERFACE=\"source [find interface/kitprog3.cfg]; set ENABLE_POWER_SUPPLY <mV>";\
Where [mV] defines target voltage in millivolts. For example:
    {
        "label": "Program",
                "type": "process",
        "command": "bash",
        "args": [
            "--norc",
            "-c",
            "make -j8 program _MTB_RECIPE__OPENOCD_INTERFACE=\"source [find interface/kitprog3.cfg]; set ENABLE_POWER_SUPPLY 3300";\ --output-sync"
        ],
        "windows": {
            "command": "${config:modustoolbox.toolsPath}/modus-shell/bin/bash.exe",
            "args": [
                "--norc",
                "-c",
                "export PATH=/bin:/usr/bin:$PATH ; ${config:modustoolbox.toolsPath}/modus-shell/bin/make.exe -j8 program _MTB_RECIPE__OPENOCD_INTERFACE=\"source [find interface/kitprog3.cfg]; set ENABLE_POWER_SUPPLY 3300";\ --output-sync"
            ]
        },
        "problemMatcher": "$gcc",
        "group": {
            "kind": "build"
        }
    },
- Save the changes to the file.
Power cycle programming mode with KitProg3_MiniProg4
This section is applicable to PSOC™ 6 and PSOC™ 4 only.
By default, Launch Configurations use Reset mode to program the device. However, Reset mode is not available in all situations (for example, if the XRES pin is not available on the part's package). In these cases, Launch Configurations use an alternative reset with software. However, using the software reset type is not sufficient in cases in which access to the device's DAP is restricted (such as when set by security settings).
If there is no XRES pin available and DAP access is restricted, the only way to reset a part is to use Power Cycle mode. Follow these instructions to add commands to the launch configuration and switch to Power Cycle mode.
Verify the voltage range supported by the target MCU, since it can be damaged by supplying unsupported voltage. Make sure that your MCU is not powered externally before supplying power via the KitProg3_MiniProg4.
Debug session
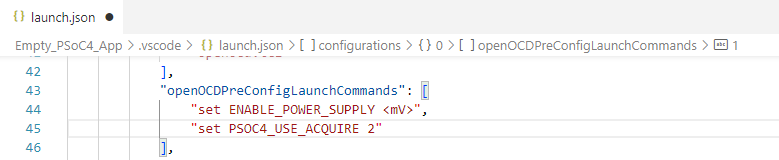
To enable power cycle during a debug session, edit the Launch configurations:
-
Open the Run and Debug view, select the launch configuration to be modified, and click the gear icon that opens the selected launch configuration in the launch.json file.
-
Look for the
openOCDPreConfigLaunchCommandsproperty. If it is not present, add it. Update the property to include the following value:- For PSOC™ 6:
        "set ENABLE_POWER_SUPPLY <mV>",
        "set ENABLE_ACQUIRE 2"
- For PSOC™ 4:
        "set ENABLE_POWER_SUPPLY <mV>",
        "set PSOC4_USE_ACQUIRE 2"
Where [mV] defines target voltage in millivolts. For example:
- Save the changes to the file.
Programing or erasing
To enable power cycle when programing or erasing, edit the Task configurations:
-
On the main menu, select Terminal > Configure Task... .
-
On the dialog, select the task to be modified, which opens the tasks.json file to that task.
-
Update the task to add the following value to the
argsproperty:- For PSOC™ 6:
_MTB_RECIPE__OPENOCD_INTERFACE=\"source [find interface/kitprog3.cfg]; set ENABLE_POWER_SUPPLY <mV>; set ENABLE_ACQUIRE 2;\"
- For PSOC™ 4:
_MTB_RECIPE__OPENOCD_INTERFACE=\"source [find interface/kitprog3.cfg]; set ENABLE_POWER_SUPPLY <mV>; set PSOC4_USE_ACQUIRE 2;\"
Where [mV] defines target voltage in millivolts. For example:
- Save the changes to the file.
Program/debug using J-Link
Most PSOC™-based BSPs default to using the KitProg3/MiniProg4 programmer/debugger launch configurations. This section covers how to use J-Link.
Configure J-Link programmer/debugger settings
- Open your ModusToolbox™ application's bsp.mk file and enter the following variable:
BSP_PROGRAM_INTERFACE=JLink
- Also enter the following variable to specify the path to the J-Link install directory:
MTB_JLINK_DIR=<path to J-Link>
-
Save the bsp.mk file.
-
In a bash Terminal run:
make vscode
When the command completes, J-Link configurations will be shown. These are the same configurations described in Program/debug common, but applicable to J-Link.
-
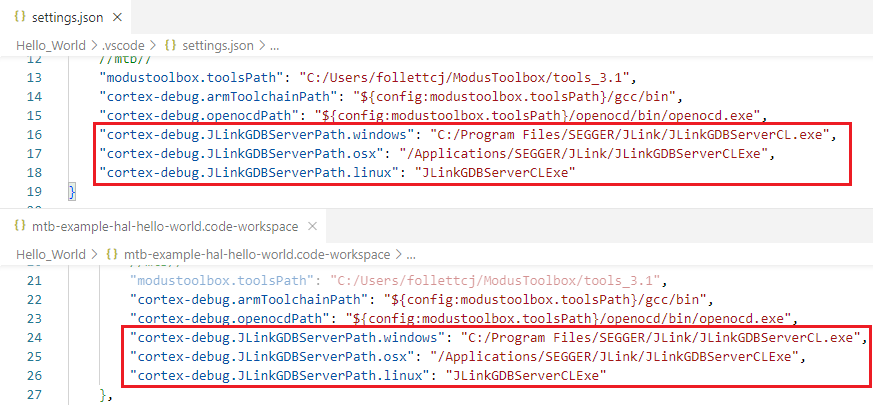
Open the settings.json file and [app].code-workpace file to verify the path to the J-Link GDB server.
For example, the default on Windows is:
"cortex-debug.JLinkGDBServerPath": "C:/Program Files/SEGGER/JLink/JLinkGDBServerCL.exe"
Connect the Kit
Follow the instructions provided with the kit and from SEGGER to connect it to the computer with the J-Link probe.
Multi-core debugging
Projects created for VS Code also provide debug configurations for multi-core applications. They support these probes:
- KitProg3 onboard programmer
- MiniProg4
- J-Link (See Configure J-Link programmer/debugger settings )
Configurations
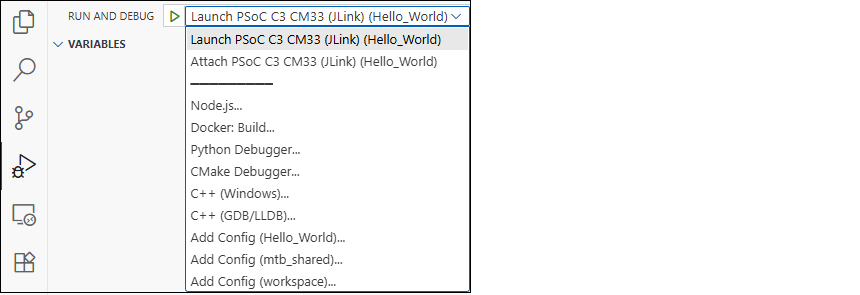
The configurations support debugging one core at a time and multiple cores as well. After the application has opened, there will be several configurations available for use in the Run and Debug tab of Activity Bar as shown.
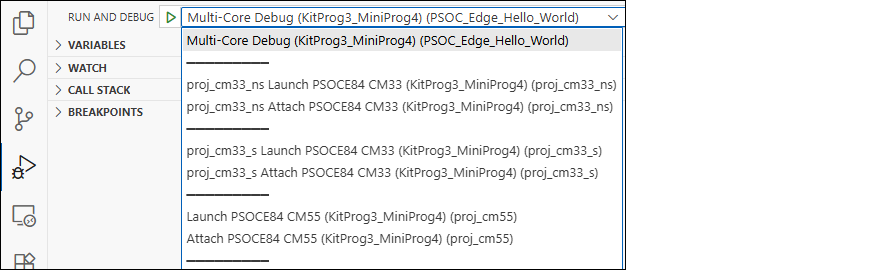
These include:
-
Multi-Core Debug : programs multiple hex files, launches OpenOCD/J-Link GDB Server and starts multi-core debug session
-
Launch [device] : launches debug session on the chosen core
-
Attach [device] : attaches to the running core
In addition to these configurations, there is associated VS Code tasks available through the main menu Terminal > Run Task.
-
Erase Device : erases all internal memory banks.
-
Program [application_name] : downloads combined hex file into the flash.
-
Program [project_name] : downloads project-specific hex file into the flash.
-
Erase All : If present, erases all internal and external memories.
Launch the configuration
To launch multi-core debugging, run the Multi-Core Debug configuration. You will end up with a debug session containing two debug processes in CALL STACK view.
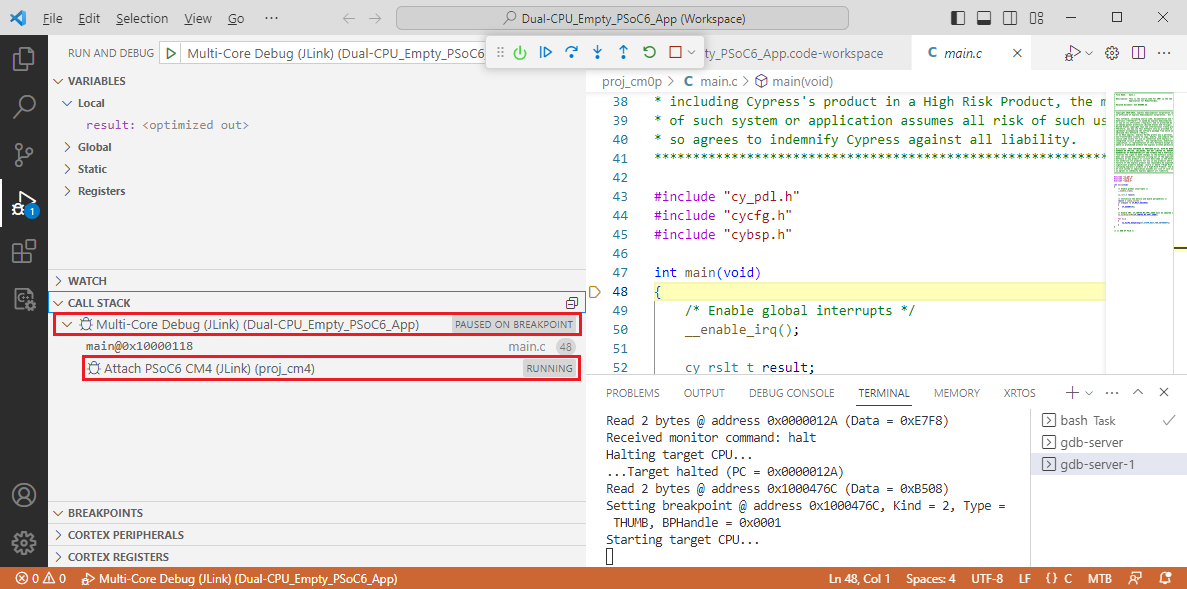
Once a session has started, the CM0+ core is halted at the beginning of main(), while the CM4 core is spinning in an endless loop in boot code, waiting for start. It will start and halt at main() as soon as the application running on the CM0+ executes the Cy_SysEnableCM4() function.
In the CALL STACK view you can observe two debug processes, each of them associated with a specific core. You can switch between the cores by selecting the appropriate process.
There is one limitation for XMC7000 MCUs. Before launching a multi-core debug session, you must program the MCU by launching the Program Application configuration.
Multi-core debug CM33 secure application booting from RRAM
When using multi-core debug CM33 secure applications booting from RRAM (for example PSOC_Edge_RTC_periodic_wakeup), you must configure the launch configuration to add the SMIF IP enabling commands.
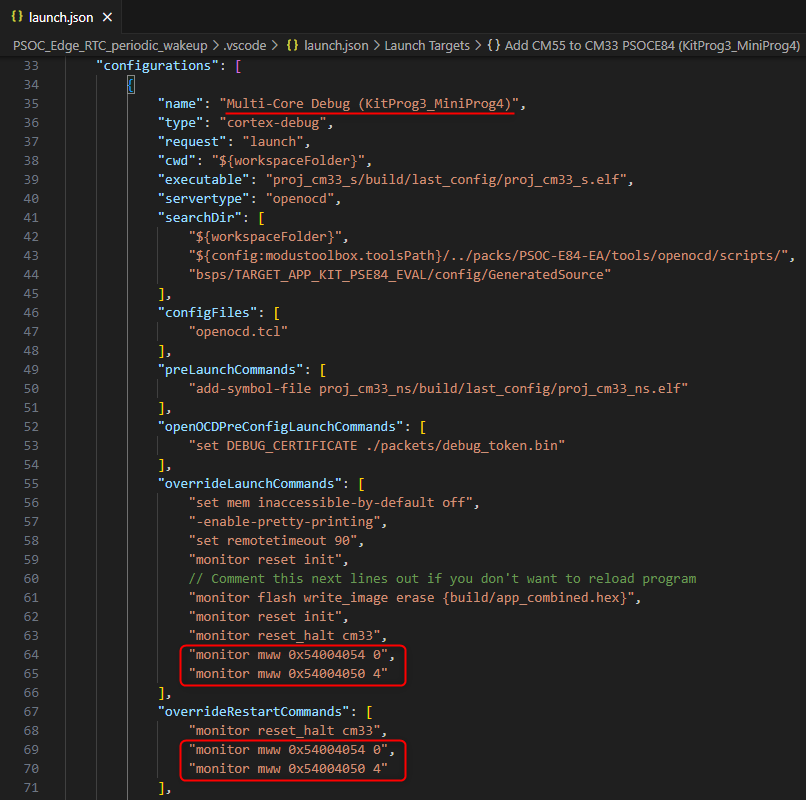
Add the following to overrideLaunchCommands and overrideRestartCommands parameters in the "Multi-Core Debug" configuration:
For KitProg3/MiniProg4
monitor mww 0x54004054 0
monitor mww 0x54004050 4
For J-Link
monitor memU32 0x54004054=0
monitor memU32 0x54004050=4
Program/debug secure configuration devices
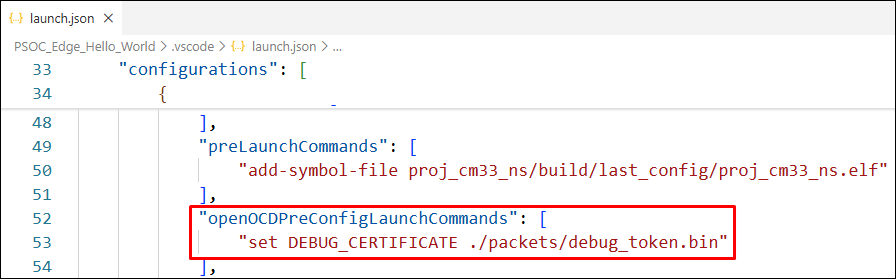
The BootROM on devices such as PSOC™ Control and PSOC™ Edge can temporarily disable access to the core's Access Port (AP). This behavior is determined by the security policy during device provisioning. However, access can be re-enabled using a certificate (debug token). If the debugger identifies that the AP is disabled, it will upload and verify the certificate located in the ./packets/debug_token.bin file within the current project folder.
For details about PSOC™ Control C3 and PSOC™ Edge E8 MCU security, refer to Application Notes:
By default, the certificate is located in ./packets/debug_token.bin in the application root folder for both OpenOCD and Segger J-Link.
OpenOCD
You can optionally make changes to the certificate’s setting using make commands and OpenOCD commands.
Make variable (Program and Debug
You can optionally specify a different path and address for the certificate using the following OpenOCD commands:
To change the location and name of the certificate (address cannot be changed) for programming and debugging, use the make variable CY_DBG_CERTIFICATE_PATH.
You can use the variable in the Makefile. For example:
CY_DBG_CERTIFICATE_PATH=../new_location/new_name_4_token.bin
If you use this variable, it will apply the new path to the certificate for all Launch Configurations (Debug, Program, Erase), but you must first regenerate the Launch Configuration using the make vscode command.
You can also run the make variable in a terminal, and it will only apply to the specific make command. For example:
make program CY_DBG_CERTIFICATE_PATH=../new_location/new_name_4_token.bin
make erase CY_DBG_CERTIFICATE_PATH=../new_location/new_name_4_token.bin
OpenOCD commands (Debug only)
Another option to specify a different path and address for the certificate is by using the following OpenOCD commands. These apply only during a debug session:
"set DEBUG_CERTIFICATE %PATH_TO_TOKEN%"
"set DEBUG_CERTIFICATE_ADDR %HEX_ADDRESS%"
J-Link
For single-core applications, the certificate must be located in ./packets/debug_token.bin in the application root folder. Its name and location cannot be changed.
For multi-core applications, there must be multiple certificates located in ./packets/debug_token.bin in the application root folder, as well as all sub-project folders. The names and locations cannot be changed.