Multi-core debugging
This section describes how to set up multi-core debugging in IAR Embedded Workbench for Arm IDE (IAR). For this purpose, we need to create an IAR workspace containing a few projects (one project per MCU core).
Supported debugger probes
KitProg3 onboard programmer
MiniProg4
IAR I-jet
J-Link
Create IAR workspace and projects
After creating a ModusToolbox™ multi-core application for use with IAR, do the following:
Launch IAR.
On the main menu, select
File > Close Workspace
.
On the main menu, select
File > Save Workspace
. Then, enter a desired workspace name.
On the main menu, select
Project > Create New Project > Empty project
and click
OK
.
Browse to the ModusToolbox™ project directory for one of the cores, enter a desired project name, and click
Save
.
Select
Project > Add Project Connection
and click
OK
.
On the Select IAR Project Connection File dialog, select the .
ipcf
file located in the corresponding project directory and click
Open
.
Repeat steps 2-3 and 5-6 for all other core projects in the application.
Once you have a working workspace, you need to properly configure IAR projects in order to be able to establish a multi-core debug session. Also, for some MCUs you must edit linker scripts in order to organize flash allocation properly.
Configuring IAR projects
To launch a multi-core debug session, all projects within the workspace must be properly configured. In IAR there is a concept of 'master' and 'slave' projects. Configure the CM0+ core project as the master project, and configure the other cores (CM4 for PSOC™ 6 and CM7 for XMC7000) as slave projects.
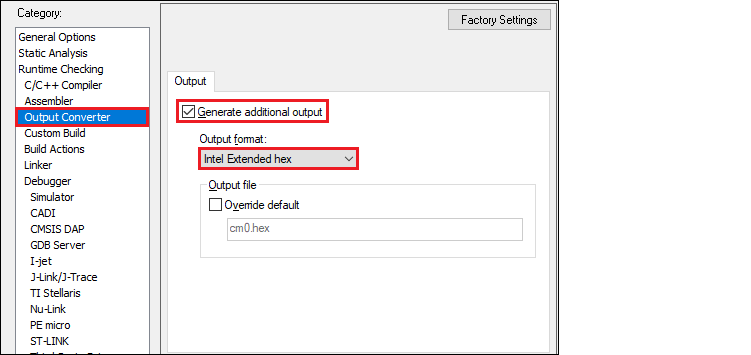
Project configuration for CM4/CM7 (slave) core(s)
Select the CM4/CM7 core project and go to
Project > Options
:
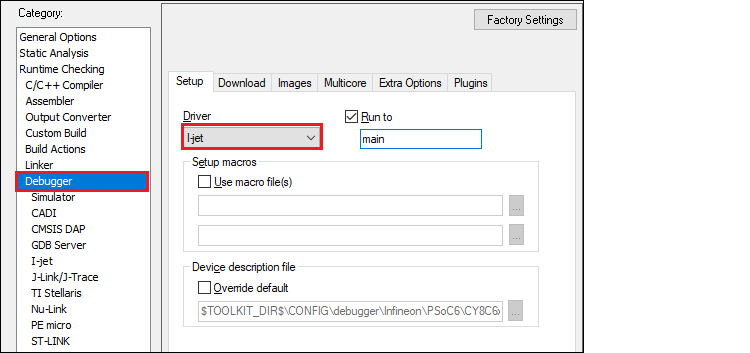
On the dialog, select the
Debugger
category in the
Setup
tab, and then select the appropriate Driver (I-jet, CMSIS-DAP, J-Link):
Enable hex file generation.
In the
Runtime Checking > Output Converter
category, select the
Generate additional output
check box.
Ensure
Output format
is set to
Intel Extended hex
.
Click
OK
.
Repeat these steps for your all projects for CM4/CM7 (for triple-core MCUs),
XMC7000/TRAVEO™ II specific steps
Some XMC7000 MCUs are triple-core devices. If you are going to use a second CM7 core in your IAR workspace, you need to implicitly set the target core in project settings so that IAR understands this project is targeting a second CM7 core. By default, IAR connects to the first CM7 core, so specifying the target core for it can be skipped.
Select the project for the second CM7 core and go to
Project > Options
.
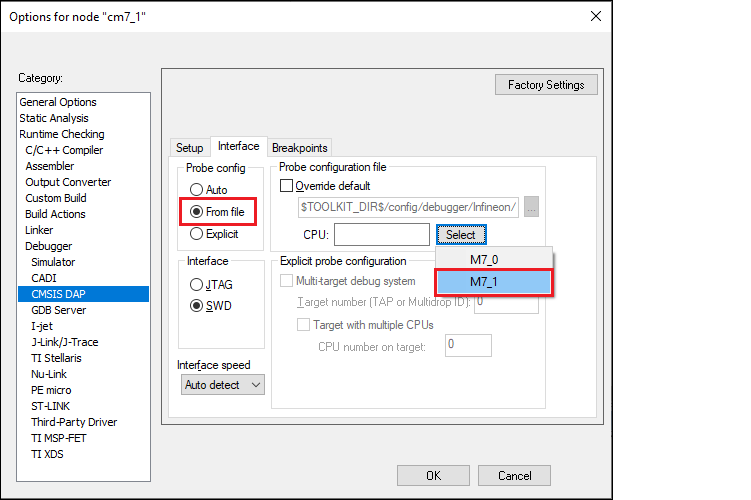
Select the probe in the
Debugger
category, and switch to the
Interface
tab.
Select the
From file
radio button, click
Select
next to the
CPU
label, and choose
M7_1
:
Switch to the
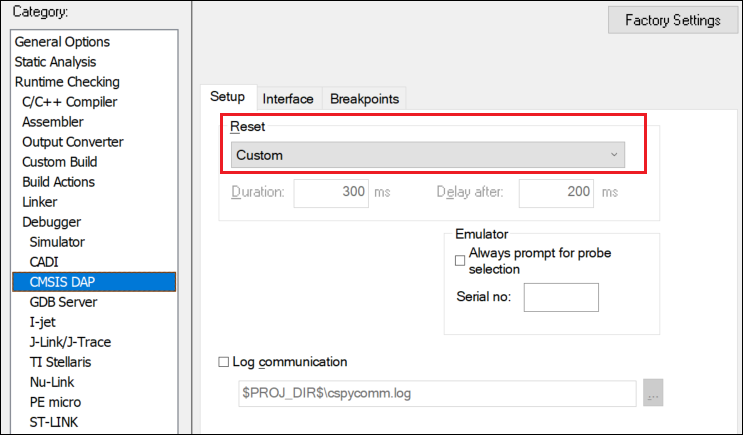
Setup
tab, and select "Custom" from the
Reset
pull-down menu.
In addition, specify a special linker script symbol in the project settings to distinguish CM7_0 from CM7_1, since there is a single linker script for the two CM7 cores:
Select the project for the first CM7 core and go to
Project > Options > Linker
.
Add
CORE_CM7_0=1
in the
Configuration file symbol definitions
field, and click
OK
.
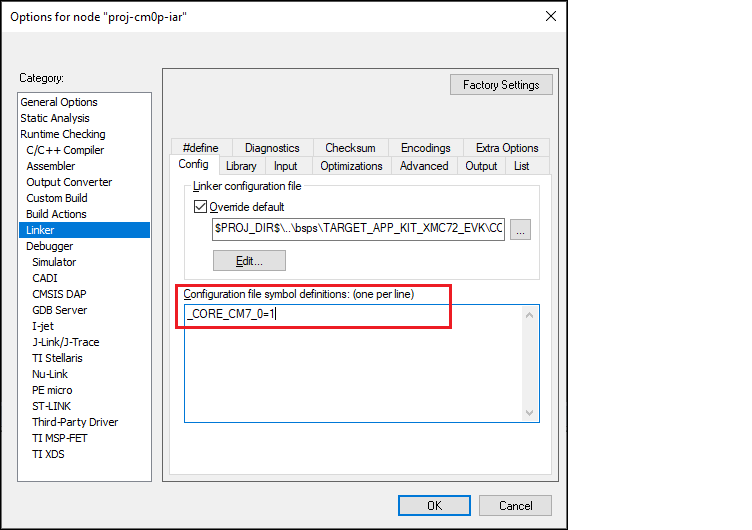
Do the same for the second CM7 core:
Select the project for the second CM7 core and go to
Project > Options > Linker
.
Add
CORE_CM7_1=1
in the
Configuration file symbol definitions field
, and click
OK
.
Note:
When debugging CM4/CM7 core stand-alone, make sure to rebuild the CM0+ project in case any changes were made, since launching a debug session only loads the CM0+ image, but does not build that CM0+ project.
Build your CM4/CM7 project(s) before moving forward.
Project configuration for CM0+ (master) core
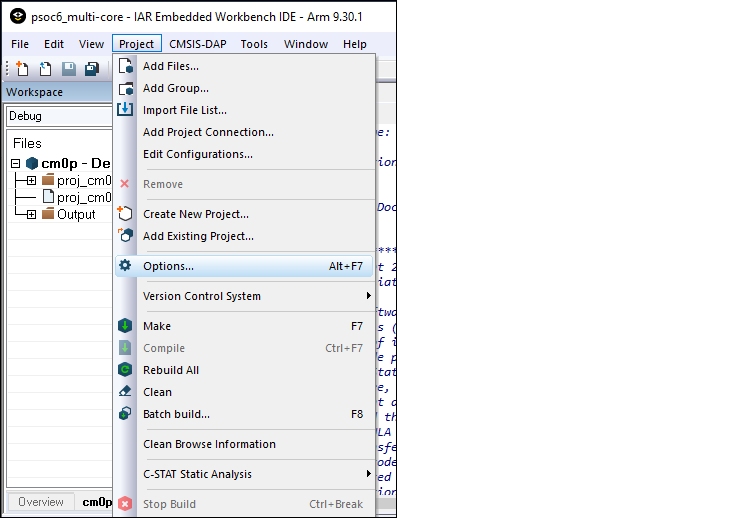
Select the CM0+ project and go to
Project > Options
:
On the dialog, select the
Debugger
category in the
Setup
tab, and then select the applicable
Driver
(I-jet, CMSIS-DAP, J-Link):
Switch to the
Images
tab to specify the extra image to be downloaded prior to debugging in order to download images of all projects in one process.
Select the
Download extra image
check box.
Provide a
Path
to the CM4/CM7's
HEX
image.
Enter 0 for
Offset
.
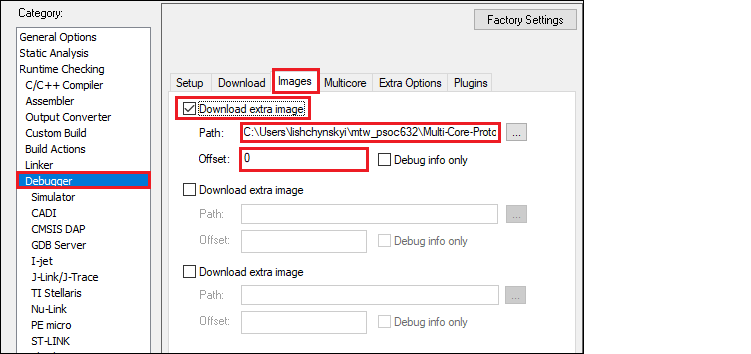
If you provide an OUT file instead of a HEX file, the IAR IDE will fail to halt at the beginning of
main()
due to the main function present in both the CM0+ and CM4/CM7 OUT files.
Note:
For triple-core MCUs you should download two extra images.
Add a prebuild command to build all projects prior to programming/debugging. In the
Build Actions
category set
Pre-build command line
to:
iarbuild.exe "<cm4/cm7_proj_loc>.ewp" -make Debug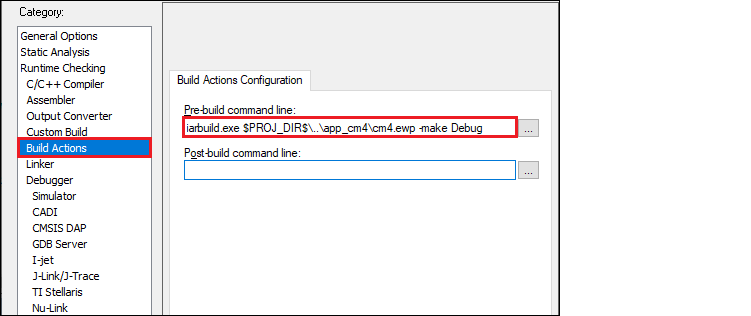
If your MCU has three cores, you might want to also specify a post-build action to build the project for the third core in the same manner.
Enable hex file generation. In the
Runtime Checking > Output Converter
category:
Select the
Generate additional output
check box.
Ensure
Output format
is set to
Intel Extended hex
.
Click
OK
, and then select
File > Save All
to save all the changes.
Build the project.
IAR does not provide native multi-core debugging support when using a J-Link probe. This means that in order to launch multi-core debugging, you must open a few IAR IDE instances manually (one instance per core). Also, multi-core debugging with a J-Link probe lacks some features available with CMSIS-DAP and I-Jet probes. Therefore, depending on the target probe, you need to configure projects slightly differently.
CMSIS-DAP/I-Jet-specific configuration
Create a session configuration file.
This is an xml file containing a projects list that should be launched in a multi-core debug session. The following shows an example for a triple-core device. For a dual-core device, remove the third partner node.
<?xml version="1.0" encoding="utf-8"?>

<sessionSetup>
    <partner>
        <name>cm0</name>
        <workspace>C:\Users\mtw-multi-core\Multicore_App\multi-core_workspace.eww</workspace>
        <project>cm0</project>
        <config>Debug</config>
        <numberOfCores>1</numberOfCores>
        <attachToRunningTarget>false</attachToRunningTarget>
    </partner>
    <partner>
        <name>cm7_0</name>
        <workspace>C:\Users\mtw-multi-core\Multicore_App\multi-core_workspace.eww</workspace>
        <project>cm7_0</project>
        <config>Debug</config>
        <numberOfCores>1</numberOfCores>
        <attachToRunningTarget>true</attachToRunningTarget>
    </partner>
    <partner>
        <name>cm7_1</name>
        <workspace>C:\Users\mtw-multi-core\Multicore_App\multi-core_workspace.eww</workspace>
        <project>cm7_1</project>
        <config>Debug</config>
        <numberOfCores>1</numberOfCores>
        <attachToRunningTarget>true</attachToRunningTarget>
    </partner>
</sessionSetup>
Configure multi-core debugging for the CM0+ project.
Go to
Project > Options -> Debugger
.
Switch to the
Multicore
tab.
Select the
Advanced
radio button and specify a path to the session configuration file in the
Session configuration
field.
Click
OK
.
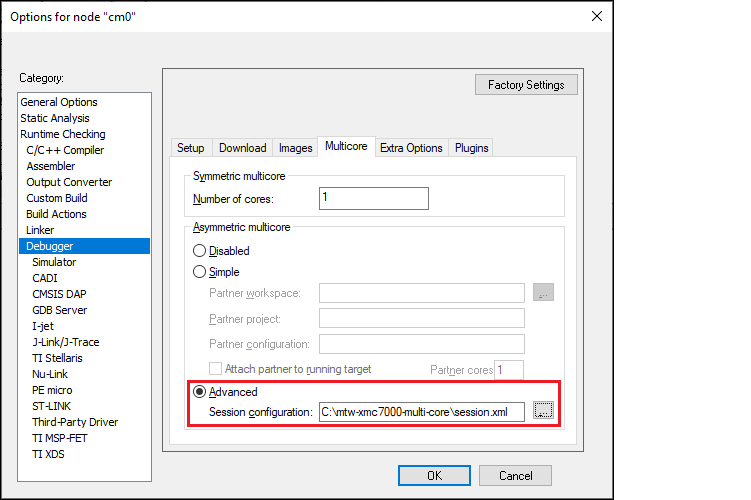
Save the workspace.
Launch multi-core debug session with CMSIS-DAP/I-Jet
Select the CM0 project and click the
Download and debug
button.
IAR builds all projects, programs all the separate images, and launches a multi-core debug session. IAR opens a separate IDE instance for each project specified in the session file. For dual-core MCUs, it should look like to this:
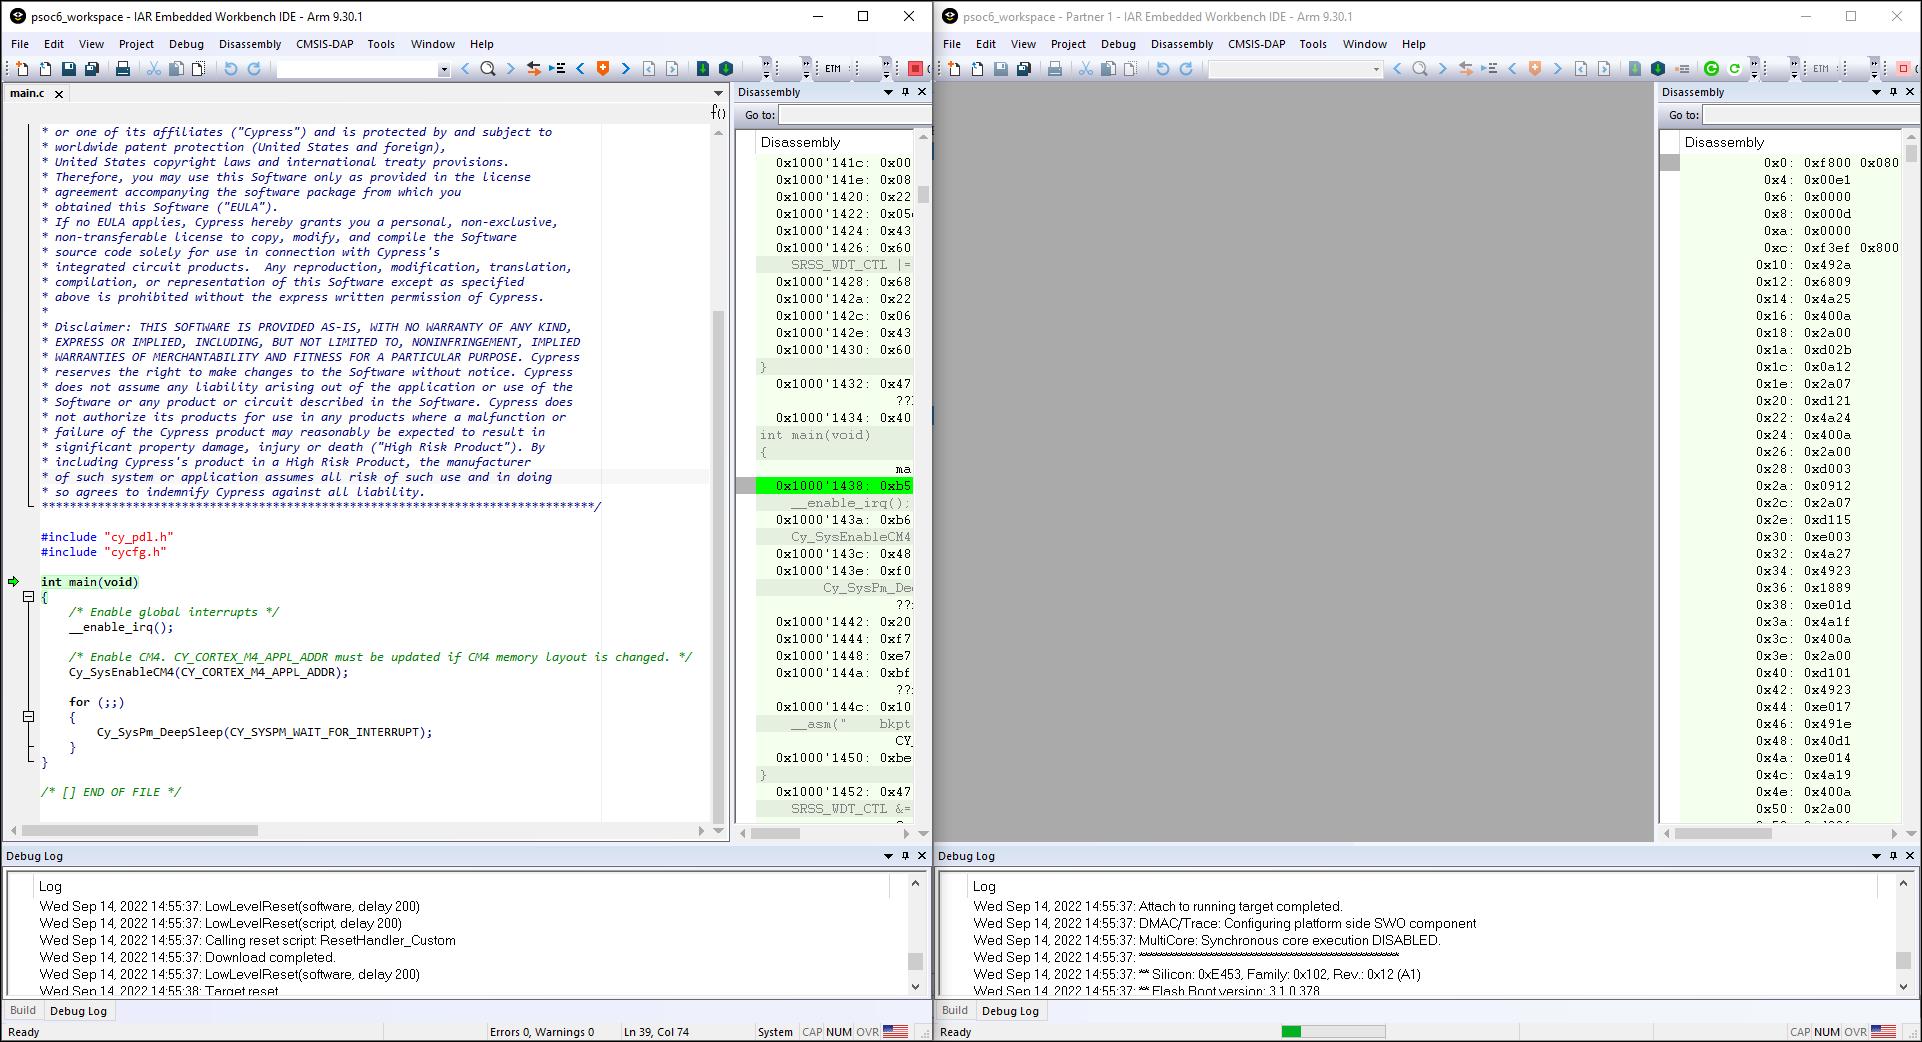
The left side of the screen shows the IAR IDE instance attached to the CM0+ core. The right side shows the CM4 core not started yet. Once the
Cy_SysEnableCM4()
function is executed on the CM0+ core, the CM4 will start executing its application.
You can step through the code by switching back and forth between the two IAR IDE instances.
Launch multi-core debug session with J-Link
The IAR IDE does not have native support for the J-Link driver, which imposes some limitations:
IAR will not automatically open separate IDE instances for each core, thus you need to do it manually.
Some enhanced features are not available; see the Multi-core toolbar and CTI usage section for more details.
To launch multi-core debugging with J-Link:
Open your multi-core IAR workspace in separate IDE instances (the number of IDE instances should be equal to the number of cores on your MCU).
Select the CM0+ project in the first IDE instance and click
Download and Debug
. The debugger will download all images, reset the target, and halt at the beginning of the CM0+ project's
main()
.
Switch to the other IDE instances and select:
Project > Attach to Running Target
.
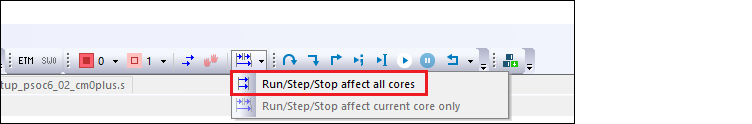
Multi-core toolbar and CTI usage (I-Jet and CMSIS-DAP only)
When multi-core debugging is established through I-Jet or CMSIS-DAP drivers, a multi-core toolbar becomes available. It allows you to halt and resume all/single core(s) from within a single IDE instance.
Also, there is a feature called cross trigger interface (CTI). This allows you to immediately halt/resume one core when another core is halted/resumed. For example, this might be useful if you need to check what code is executing one of your cores when another hits a breakpoint. To use CTI, select the
Run/Step/Stop affect all cores
option available for multi-core applications: